M-Lab at Pulse Research Week with Internet Society and Giga
From December 8-11, 2025, Measurement Lab (M-Lab) joined the Internet Society Pulse Research Week. On Day 4 Pavlos Sermpezis, M-Lab’s Director, Technical Lead, presented the Internet Quality Barometer prototype at the Giga offices in Barcelona. M-Lab discussed with the audience how IQB could be adapted for education.
A Hands-On Tutorial with Reverse Traceroute
Internet paths are often asymmetric: packets from A to B usually take a different route than packets in the reverse direction from B to A. This post walks through a reproducible case study using Reverse Traceroute (RevTr) to compare forward and reverse paths for NDT speed tests.
Open Measurement Hackathon at the ACM Internet Measurement Conference (IMC) 2025
M-Lab, OONI, IIJ, Dioptra Research Group, Cloudflare Radar, Reverse Traceroute, and IODA hosted the Open Measurement Hackathon, October 31, 2025, following the ACM Internet Measurement Conference (IMC) 2025 in Madison, Wisconsin, USA.
Measurement Lab publishes new dataset of NDT7 measurements
A new dataset of ndt7 measurements is now available in BigQuery, offering access to measurements from a set of servers whose data had not been previously published.
IP Route Survey (IPRS) data published in M-Lab
We are excited to announce that the Dioptra research group at Sorbonne University is making its IP Route Survey (IPRS) available on M-Lab.
How M-Lab Determines User Location and Selects Servers
This blog post describes the two geolocation systems M-Lab uses for server selection and data annotation and how researchers can leverage metadata about the server selection to identify potentially erroneous client geolocation results in the annotated data.
Wehe data is now available in BigQuery
M-Lab and the Wehe team are pleased to announce that Wehe data is available for open access in BigQuery.
Join us at the IMC 2023 Hackathon on Network Interference using Open Data
Are you attending the Internet Measurement Conference (IMC) 2023?
July 2023 Office Hours
Join us for M-Lab’s next Community Office Hours on July 20, 2023 at 11:00am EDT!
Introducing Data Transfer Limits to NDT
Consumer Internet speeds increasing to 1Gbps and beyond pose a scaling challenge to servers engaged in measuring global Internet quality, as every bit represents physical infrastructure and energy costs to measure that information. Maintainers of Measurement Lab are investigating options to limit the amount of data transferred by an NDT test that will reduce resource strain while maintaining quality of Internet measurement and sustain user experience.
Introducing M-Lab Community Office Hours
Are you new to M-Lab data? Do you have questions about how to use it or how it can fit into your research?
M-Lab is now providing Cloudflare AIM data for open access
Want to know more about your Internet connection? M-Lab is proud to announce that we are now publishing Cloudflare’s Aggregated Internet Measurement (AIM) dataset, which puts network quality in an end-user context.
M-Lab Hackathon at IMC 2022
Summary of M-Lab’s hackathon at IMC 2022!
M-Lab at SIGCOMM 2022
Measurement-Lab was excited to be represented at this year’s SIGCOMM conference with a tutorial and conference talk in the Best of CCR session. This post overviews M-Lab’s activities at SIGCOMM and includes references for the tutorial materials.
M-Lab Hackathon at IMC - Register by September 23rd!
Come analyze Internet performance data with M-Lab at ACM Internet Measurement Conference 2022!
Release notes for Unified Views with exposed Row Filters
Monday August 15th we will be updating the NDT unified views to provide researchers with access to the row filter logic used to exclude rows that are not believed to be representative measurements of network performance. This change enables interested researchers to better understand MLab’s data filtering and to easily craft alternate filters to verify our assumptions, or to filter data to address questions other than network throughput.
Extracting Single-Path Traceroutes
In response to community feedback, we’ve developed a proof of concept tool that examines and extracts single-paths scamper‘s MDA traceroutes.
An Overview of M-Lab’s Traceroute Data
Summary
This blog post is a report on M-Lab’s traceroute data so the community can have a better understanding of what the data we make available includes.
Updates to Geo Filters
Changes to our geographic annotations have resulted in changes to geographic filters.
ARC of Research pt. 2: Exploring Data Sources Relevant to Our Questions
In this second “analysis recommendations in context” post, we will explore the refined research questions from the first post, resulting from our discussion of how to design specific questions with understanding of available data source(s) and the context of what each contains. We emphasized the importance of selecting a data source that matches the goal of the research question. This is critical for analyses of broadband measurement data, particularly when the research goal is to compare the results to one another, to national broadband standards or specific funding requirements, or to align with advertised terms of ISP service.
Migration to the v2 Data Pipeline
If you typically use the measurement-lab.ndt.unified_uploads or measurement-lab.ndt.unified_downloads views, then nothing will change. We are updating the ndt5, switch, and tcpinfo schemas, removing obsolete views, and renaming some views in preparation for improving ease of use and documentation.
Analysis Recommendations in Context - ARC of Research pt. 1: Asking the Right Questions
A while back, our team published some analysis recommendations for anyone working with our data from the Network Diagnostic Tool (NDT), comparing it to other Internet measurement data sets, and drawing conclusions or inferences about the data. These recommendations are intended to provide guidance about analyzing crowdsourced data, because we know that it’s easy for analyses to end up with what looks like a striking comparison or finding, but that may not actually be supported by the underlying measurements or data. But because recommendations are only that, we’re now beginning a series of posts to unpack those recommendations with some context and examples. First, we’ll recap our previous recommendations post with more context, and finish with an example that we’ll continue working with in subsequent posts.
Revisiting National Broadband Datasets and Maps
When thinking about broadband in the United States, the first thing people likely think about is whether their connection is fast enough– are they getting the speeds they need to do business, go to school, etc. The dominance of “speed” in assessing broadband service goes all the way to the top- the FCC defines broadband according to the achievable download and upload speeds to the Internet. But generic speed test measurements only go so far in observing a connection’s performance, and M-Lab and the research community are working to expand the concept of broadband measurement beyond basic speeds.
Evolution of M-Lab's Geographic and Network Annotations
In our recent roadmap post, we shared a list of milestones that the team is working on this and last quarter. Our Datatype migration and Standardized Columns milestone references the gardener service, which maintains and reprocesses M-Lab data, as well as the UUID annotator, that generates and saves per-connection metadata as annotations to user-conducted measurements. This post provides more detailed information about how these services have annotated measurements with geographic and network information in the past and present, and expands on what current work is happening now as mentioned in our roadmap post.
Exploring NDT Data by Geography in Baltimore City
Baltimore Data Day is an annual conference bringing together “community leaders, nonprofit organizations, government and civic-minded technologists to explore trends in community-based data and learn how other groups are using data to support and advance constructive change.” This year the 11th annual event expanded to become Baltimore Data Week, celebrating the 20th anniversary of the conference’s host organization, the Baltimore Neighborhood Indicators Alliance (BNIA). As a Baltimorean myself, I was honored to be invited to give a talk about the M-Lab platform and our open data, on the conference’s “Digital Inclusion Day.”
Measurement Observations on Network Performance During the COVID-19 Pandemic in Northern Italy
OONI was recently invited to participate in a NetGain Partnership webinar (titled “Surging Demand and The Global Internet Infrastructure”) to discuss the changing landscape for internet infrastructure and technology in the wake of the COVID-19 pandemic.
As part of our preparation for this webinar, we looked at network performance measurements collected from northern Italy over the last months (i.e. when Italy was hit hard by the COVID-19 pandemic) in an attempt to understand whether and to what extent there was a correlation between increased internet use and reduced network performance. As our observations may be of public interest, we decided to share them through this blog post.
Long Term Supported Schemas Using Standardized BigQuery Columns
Following the M-Lab platform upgrade in Nov. 2019, the development team began a series of follow up projects to enable access to NDT data for various audiences with differing needs. The first step in that process was the publication of “unified views”, which present the most commonly used fields in NDT data, and only show tests that meet our current, best understanding of test completeness. This was one step toward Long Term Support of stable schemas for our tables and views in BigQuery. In other words, a lot of work is happening in the background to support long term support for standard BigQuery columns across all M-Lab datasets.
Data Visualization Site Upgrade
The M-Lab team completed a major platform upgrade in November 2019, which required publication of NDT data to new BigQuery tables and views. Consequently, the aggregate NDT data presented on our visualization website has not been updated. We’re pleased to report that the M-Lab data visualization site will soon be upgraded.
Accessible M-Lab NDT data for Internet Performance research during COVID-19
In response to increased reliance on the Internet during the COVID-19 pandemic Measurement Lab, with the support of Internet Society, is dedicated to making our NDT data more accessible so everyone with an interest in Internet Performance can use our data in their research. We started with a visualization of test count and median download speeds in New York, India, and Sao Paulo as an example of what data was available to researchers through BigQuery.
NDT Unified Views Now Published
In November 2019, M-Lab reached a milestone after upgrading the operating system, virtualization, and TCP measurement instrumentation running on our servers worldwide. The upgrade also included a completely re-written ndt-server, providing backward compatibility to old clients, as well as the new ndt7 protocol. With the change in system architecture and the changes to ndt-server, our team wanted to provide unified, longitudinal views of the data in BigQuery that embed the provenance for all tests.
New Traceroute Binary on M-Lab platform
M-Lab has always committed to provide traceroute data for the tests running on M-Lab platform. Since we launched new platform in 2019 Q4, the new traceroute binary, Scamper, replaced Paris Traceroute on all our servers. Our BigQuery table for traceroute now has unified schema to cover both the legacy Paris Traceroute test data and new Scamper data. This blog is to analyze the difference between the legacy data and new data.
Platform Transition Update - NDT Dataset, Tables, & Views
If you’ve been following our blog over the last few months, you know M-Lab has been working toward a complete server platform upgrade. As of November 20, 2019, all M-Lab servers are now managed by Kubernetes, running Docker container services for all experiments. This transition has greatly improved our platform management, this post addresses the short term impact on downstream data users and applications, and outlines a temporary solution and our longer term for new NDT tables/views.
Running Your Own ndt-server
If you’ve followed the M-Lab blog over the past year and a half, you’ll know that we’ve been engineering and testing a massive upgrade to our server software and how it’s managed and deployed [1] [2] [3] [4]. That’s been a ton of work, and our team is excited to now complete the migration from the PLC/vserver platform to the new k8s stack.
We expect some great derivative outcomes of migrating to Docker and Kubernetes both for ourselves in managing the platform and measurement tests we host, and for the community as well. In particular, the NDT server was completely rewritten in Golang, and being fully “dockerized” the server is now portable and usable outside of the M-Lab platform by others. This is really exciting because not only can M-Lab use our tools to measure the public Internet, but anyone can run our server now to measure their network privately using the same methods and tools. This post kicks off a series of blogs that will demonstrate various ways to use M-Lab server and client tools, starting with ndt-server.
M-Lab 2.0 Platform: Global Pilot Assessment
We deployed the new M-Lab platform to 1/3rd of the M-Lab fleet, and now we need to assess whether or not it is a performance regression, relative to the old platform. As long as we can be sure the performance of the new platform does not constitute a regression, then we can roll out the new platform and be confident that we have not made anything worse.
Inspiring Work of Broadband Advocates and Researchers at the Michigan Broadband Summit
The first annual Michigan Broadband Summit was held on Sept. 24, 2019, sponsored by the MERIT research and education network, and it was my pleasure to attend on behalf of M-Lab. 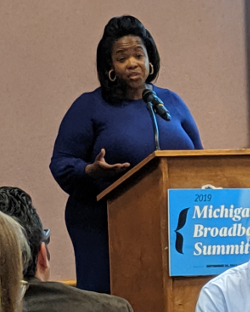 The gathering was an opportunity to learn more about the amazing work that MERIT, industry, municipalities, cooperatives, school districts and others are doing to improve internet access and service quality in Michigan. I came away inspired by every conversation and presentation, with the keynote from Francella Ochillo from Next Century Cities, and the MERIT team’s presentation of the Moonshot framework being particularly moving.
NDT Dataset - 2 Billion Rows and Growing
While we’ve been hard at work this year on the M-Lab 2.0 Platform Upgrade and Global Pilot, the number of people all over the world runing NDT tests has continued to grow. We collected 2 billion total NDT results between 2009-01-01 and the beginning of the second quarter of 2019, and we are on track to add 500 million just from April through September of this year! We now regularly exceed 3 million NDT tests per day, compared with 2.4 million per day at the end of the first quarter of 2019, 1 million per day two years ago, and 50k per day four years ago.
New Traceroute Table and Schema Now Available
To make our traceroute data in BigQuery more useful, researchers have sought an easy way to reconstruct the path of hops for the same test. This task was particularly hard because the schema, which was designed many years ago, put the hops of the same test in different rows.
To address this need from many of our partners and researchers, M-Lab is delighted to announce that the traceroute BigQuery table in the aggregate dataset is now available to the public. The new traceroute schema has one test per row, and all hops for a single test are inside the same row.
M-Lab 2.0 Platform: Global Pilot Entry
For a while, we’ve been developing M-Lab 2.0 [1, 2]. This month, we are launching a global pilot for the new software stack. The changes include:
- Stock Linux 4.19 LTS kernels with modern TCP and Cubic congestion control
- Standard instrumentation for all experiments using tcp-info
- Virtualization and container management using Kubernetes and Docker
- Reimplementation of the NDT server
M-Lab Participates in Internet Measurements Workshop at 2019 African Internet Summit
M-Lab was pleased to be invited to contribute to the Internet Measurements workshop at the 2019 African Internet Summit, June 15-16, 2019 in Kampala, Uganda. M-Lab tech lead, Peter Boothe, and advisor, Georgia Bullen, presented a hands-on tutorial on querying and visualizing performance and routing datasets.
Traceroute BigQuery Table New Data Temporarily Halted for Schema Change
M-Lab is working on replacing the current traceroute BigQuery table with new schema, which will put all hops of one test in one row of BigQuery table. The new table will have all the information in the current table but make the search of hops within one test much easier. To make this happen, we will stop the new data feed of current traceroute BigQuery table in early July, 2019. The details of new schema will be published once the conversion of all data to BigQuery tables with the new traceroute schema is completed and available to the public.
Naming BQ Datasets after M-Lab Measurement Services & Data Types
Earlier this year, M-Lab published blog post outlining our new ETL pipeline and transition to new BigQuery tables. That post also outlined where we’ve saved our datasets, tables, and views in BigQuery historically, and recommended tables and views for most researchers to use. At that time we also implemented semantic versioning to new dataset and table releases at that time, and began publishing BigQuery views that unify our NDT data across multiple schema iterations and migrations.
Michigan Moonshot Data Collection Pilot Project Launches
M-Lab is excited to highlight the launch of “Michigan Moonshot”, a pilot data collection project developed through a partnership with the MERIT Network, Michigan State University’s Quello Center, and M-Lab. We worked with MERIT developers who adapted the Piecewise codebase to build the Michigan Moonshot website.
M-Lab Visualization Site Update
If you’ve clicked on the Visualizations page on our website in the last year or so, and tried to find recent data for any location, you’ve likely been disappointed.
TLDR; - Our visualization site is BACK! Continue reading to learn more..
M-Lab 2.0 Platform Migration Update
Last year, we outlined our plans to Modernize the M-Lab Platform. This year, we’re bringing them to life. Here’s a summary of why the platform update is so valuable and what you can expect throughout the year.
AFRICOMM 2018 and AFRINIC-29
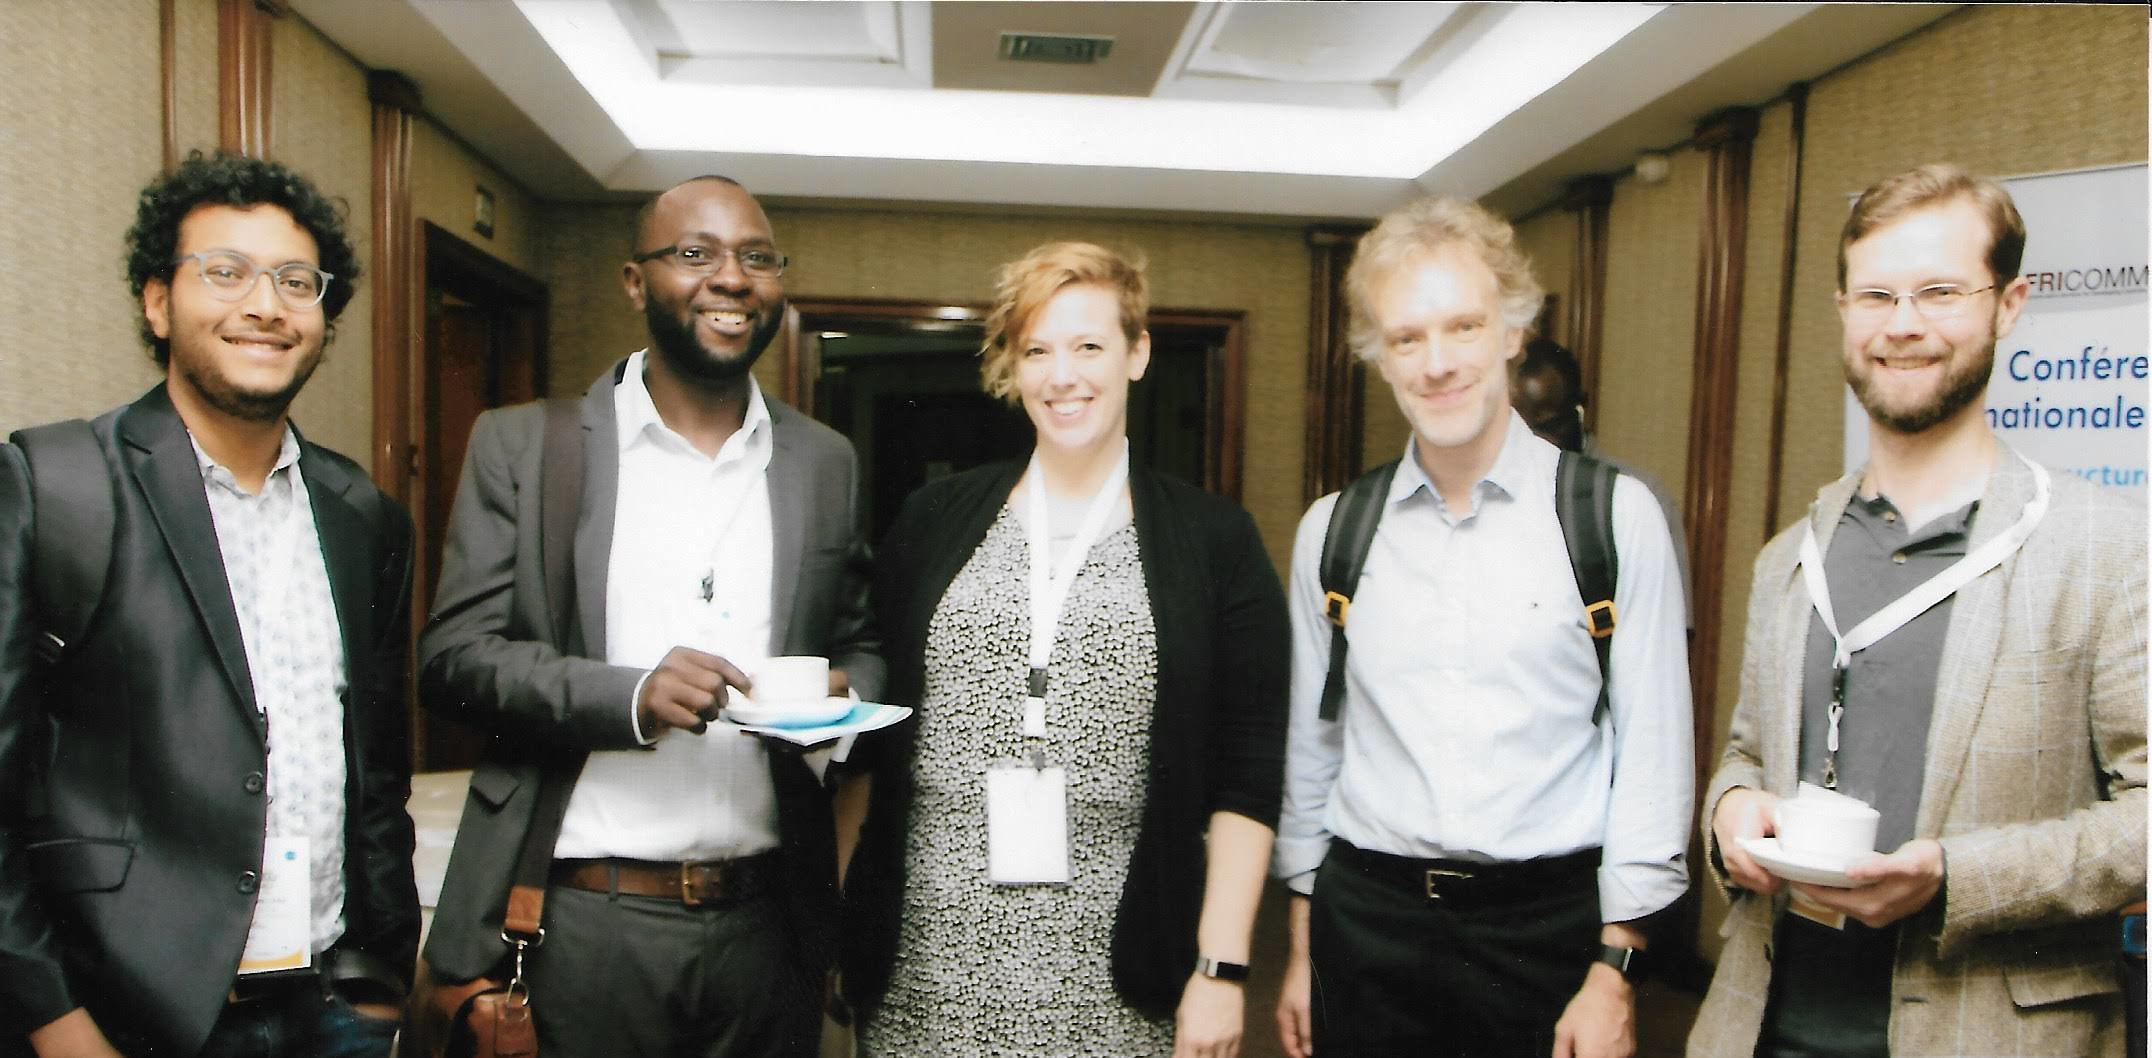 AFRICOMM 2018. Left to right: Amreesh Phokeer (AFRINIC), Josiah Chavula (University of Capetown), Georgia Bullen (M-Lab), Antoine Delvaux (perfSonar), Stephen Soltesz (M-Lab).
In late November 2018, M-Lab was invited to the Internet Measurement Workshop at AFRINIC-29 in Tunisia and to give a keynote about M-Lab and open internet measurement at AFRICOMM 2018 in Senegal. Both trips were a fantastic opportunity to deepen our relationship with researchers focused on the African Internet, learn more about how our platform is serving community needs, foster conversation around open Internet measurement, and identify opportunities for further collaboration, research and tool development to better support the Internet measurement, research and policy community in Africa.
SIGCOMM 2018 Hackathon Outcomes
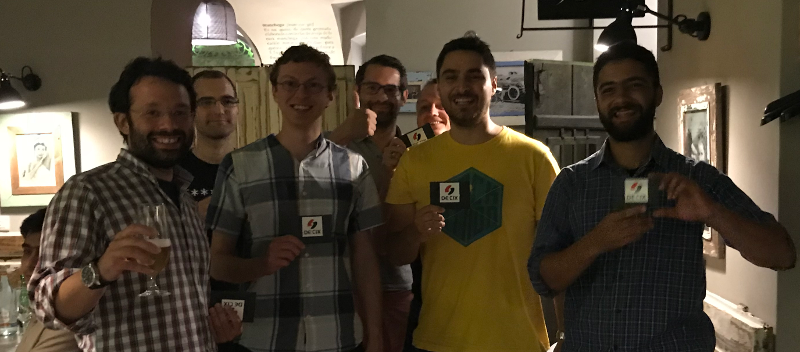
M-Lab had the pleasure of attending the first ever SIGCOMM hackathon on August 25, 2018, at the Nokia Skypark headquarters in Budapest, Hungary. The hackathon, sponsored by Nokia, DECIX, and Netflix, invited network research faculty, students, and industry professionals from around the world to form teams and develop tools, new features or analyses during the Saturday following the SIGCOMM conference.
M-Lab 10 Year Anniversary Event
We’ve reached a point in human history where, for many of us, the Internet has become a standard presence in our daily lives. In the United States, the Internet is simply part of how many of us engage with the world. In other countries (and parts of this one), the Internet remains unaffordable, unreliable, and inaccessible. The Internet unites us in many ways, and at the center of work on the future of the Internet is a dedicated community of experts exploring the questions that will move the Internet to the next level of its evolution: What is an open Internet? What is a healthy Internet? What factors contribute to the Internet ecosystem’s health?
Switch discard investigation for early 2018
On February 1st, 2018, during a regular data quality review, we identified an increase in switch discards at sites with 10Gbps equipment connected to 1Gbps uplinks. We used our switch telemetry data to assess whether there were any negative consequences for tests contained in our SideStream or NDT data sets, and then we used the same data sets to determine whether our remediation strategy had any negative effects. In both cases, we found no observable effects, indicating that everything was below the noise floor for Internet performance data.
SIGCOMM 2018 Hackathon
- When: Saturday, August 25, 2018
- Where: SIGCOMM, Budapest, Hungary
M-Lab will be at this year’s SIGCOMM hackathon in Budapest, Hungary. Check out the projects we’re hoping to work on with folks on the hackathon wiki.
M-Lab is Turning 10!
- When: Aug. 7, 2018 - Aug. 8, 2018, 9AM - 5PM
- Where: New America, 740 15th St NW #900, Washington, D.C. 20005
Measurement Lab is turning 10! On August 7 and 8, we look forward to gathering the Measurement Lab community to showcase how the platform has evolved, learn from you about how you are using M-Lab, and discuss how we plan for the next 10 years of measuring the Internet and providing public data to the world. So much has changed over the last 10 years (and that’s not just our expanding volume of longitudinal data!), come celebrate, brainstorm, analyze, and share with us.
New DISCO switch telemetry dataset
Since June 2016, M-Lab has collected high resolution switch telemetry for each M-Lab server and site uplink.
Originally designed to detect switch discards from server traffic microbursts, we now support the DIScard COllection (a.k.a. DISCO) dataset as a standard M-Lab BigQuery table: measurement-lab.base_tables.switch
Say Hello to Murakami
The Measurement Lab team has always tried to make it as easy as possible to run network measurements. Currently, most users run tests either directly from the M-Lab website, or through a 3rd party integration. Over the years, many users have requested the ability to run tests on a regular basis, e.g. daily or weekly to collect data over time. Today, we’re releasing a tool that will help you do just that.
Monitoring Interconnection Performance Since the Open Internet Order
Introduction
As a platform committed to producing empirical data for the public, Measurement Lab (M-Lab) has historically supplied regulators and other governmental entities with technical facts pertinent rule-making processes. In our February 2015 submission to the FCC’s Open Internet docket, we committed to research on the state of broadband and performance impact of interconnection in the United States. Earlier this year, the FCC began the process of re-evaluating its authority over broadband Internet services, and opened a Notice of Proposed Rulemaking. This blogpost is a shortened version comments that M-Lab filed in the docket regarding its continued research on the impact of interconnection on consumer broadband. The full filing in the FCC docket includes an elaboration of our research with additional supporting evidence and charts.
Transitioning to a New Backend Pipeline and Data Availability
M-Lab data is collected from distributed experiments hosted on servers all over the world, processed in a pipeline, and published for free in both raw and parsed (structured) formats. The back end processing component for this has served us well for many years, but it’s been showing its age recently. As M-Lab collects an increasing amount of data thanks to new partnerships, we have been concerned that it will not be as reliable.
Paris Traceroute Brownout
Summary:
In February 2017, M-Lab was notified of issues with the M-Lab data available in BigQuery. Upon investigation, a problem was identified with the Paris Traceroute collection daemon which resulted in a reduction in Paris Traceroute measurements beginning in June 2016. At the peak of the outage, fourth quarter 2016 - January 2017, approximately 5% of NDT tests had an associated Paris Traceroute test. Additionally, an issue within the data processing pipeline resulted in Paris Traceroute data that was measured and collected, not being inserted into the BigQuery tables and therefore available for use.
Measurement Lab Launches New Global Data Visualization Tools
The Measurement Lab (M-Lab) global measurement platform contains the largest collection of open Internet performance data on the planet. Hundreds of thousands of people (and rising everyday!) test their Internet connections on M-Lab and provide that data to the public domain for research, analysis and advocacy. As a consortium of research, industry, and public-interest partners, M-Lab is dedicated to providing an ecosystem for the open, verifiable measurement of global network performance. With an extensive library of data dating back to 2009, M-Lab has over 5 petabytes of information about quality of experience on the Internet contributed by people like you.
Showing Missing Data in Line Charts
The M-Lab team has been working with Bocoup’s Data Visualization team to overhaul our visualizations and give all of you better support in exploring all of the Measurement Lab data. Look for more about that soon – and reach out via support@measurementlab.net if you are interested in helping with testing and user feedback!

M-Lab has lots of data, but depending on how you slice the data, you might end up with too small of a sample size on a given day in a given location. As part of designing the Observatory visualization, we came up with the idea of using dotted lines to show that we didn’t have a large enough sample size to assert the data value, but that leaving out the data would be incorrect as well. The Bocoup Team took that further and developed a new d3 plugin, d3-line-chunked, which allows you to easily visualize gaps in your data and has good animation support.
Traffic Microbursts and their Effect on Internet Measurement
In August 2015, M-Lab was notified of potential degradation of site performance by a measurement partner based on discrepancies compared to results for their own servers. After a full investigation these patterns were found to have been caused by the unique confluence of several specific conditions. Interim remediation measures were taken in early October 2015, and the resolution of the degradation was confirmed by the partner and others. Due to these administrative actions, the episode, which we are calling the “switch discard issue,” has not affected testing conducted in the United States (the region impacted by this problem) since October 11, 2015, and thus measurements after this period are not affected by the incident. M-Lab has also conducted an evaluation of data collected during the time period in which the issue occurred, and has taken steps to remove affected measurements from its dataset. This incident will not affect use of its dataset, past or present, as a result.
Making it Easier to Use M-Lab Data
In January, M-Lab launched a beta test of new BigQuery tables for M-Lab data. Today, M-Lab is pleased to announce that the beta test was successful. The new, faster-performing tables will be M-Lab’s new standard BigQuery tables.
Before we move on to specifics, when we say faster performing, we mean a lot faster. As in, certain queries that used to take over 2 hours now complete in 8 seconds. That means that playing with the data just became a lot more fun.
To help users dig in to this data as quickly and seamlessly as possible, M-Lab has consolidated all of its data documentation and updated it to show how to take advantage of the new tables.
Announcing improved performance for M-Lab BigQuery data
Today, M-Lab is happy to announce the public beta of new M-Lab BigQuery tables. These tables provide substantially improved performance and reduce the difficulty of writing BigQuery SQL.
Data Duplication Bug in M-Lab BigQuery Data
The team working on archiving M-Lab data recently discovered that the M-Lab data hosted in BigQuery was affected by a bug that caused duplicates to appear in our dataset. Queries against M-Lab’s BigQuery dataset performed between May 2014 and April 2015 were impacted. The raw files in our Google Cloud Storage bucket were not.