New Traceroute Binary on M-Lab platform
M-Lab has always committed to provide traceroute data for the tests running on M-Lab platform. Since we launched new platform in 2019 Q4, the new traceroute binary, Scamper, replaced Paris Traceroute on all our servers. Our BigQuery table for traceroute now has unified schema to cover both the legacy Paris Traceroute test data and new Scamper data. This blog is to analyze the difference between the legacy data and new data.
The legacy data and new data are merged in the same BigQuery table measurement-lab.aggregate.traceroute. The easiest way to tell the difference between them is to check the UUID field. The legacy data has empty UUID field while the new data has a value like “neubot-sb9zt_1576697510_0000000000006A41”.
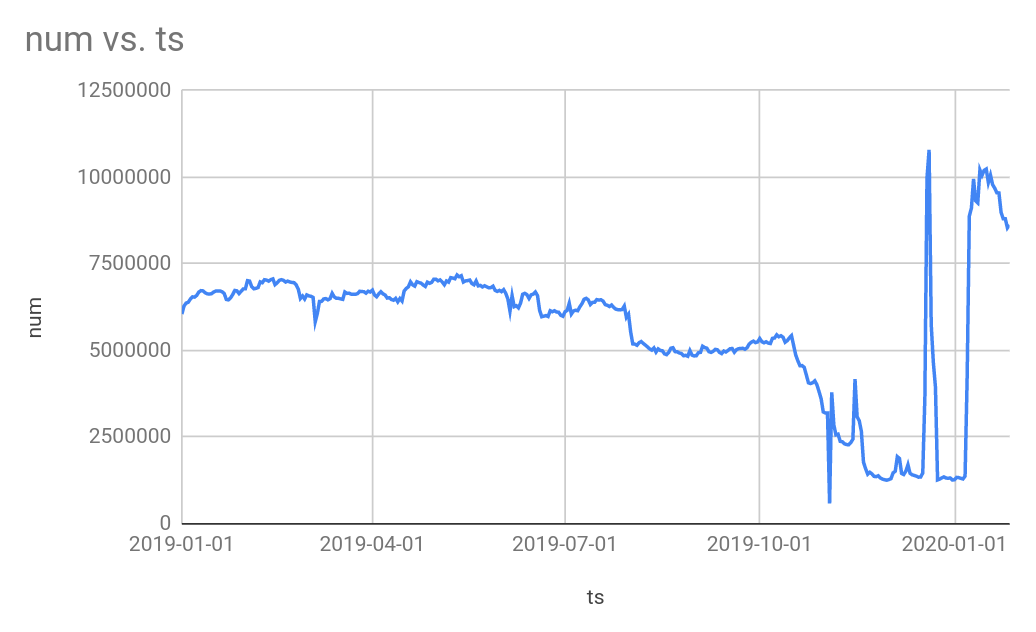
First we would like to check the test volume change. We observed significant increase in number of tests per day due to improvement of the traceroute caller code in Jan, 2020.
Before the Scamper launch, the average number of tests per day was between 6 million and 7.5 million. After the Scamper launch, we reached 10 million traceroute tests per day for the first time in Jan. 2020. The drop in late 2019 was caused by some Scamper bug. After we fixed the problem with Scamper author at the end of 2019, the number of traceroute tests bounced back dramatically.
SELECT
ts,
COUNT(*) AS num

FROM (
SELECT
  DATE(TestTime) as ts
FROM `measurement-lab.aggregate.traceroute`
WHERE
DATE(TestTime) BETWEEN DATE("2019-01-01") AND DATE("2020-01-31")
)
GROUP BY ts
ORDER BY ts ASC
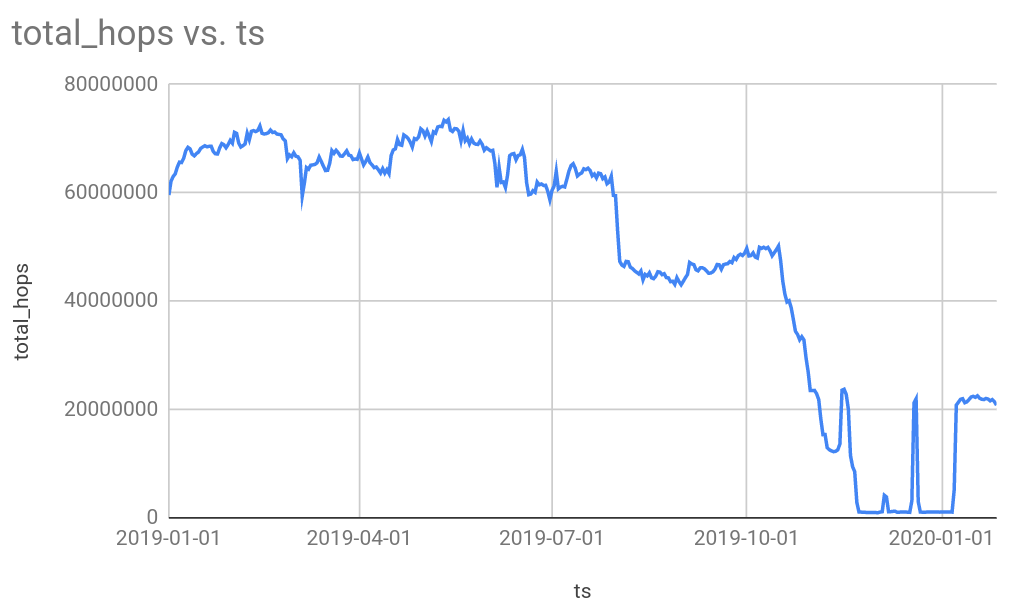
For number of hops in all those tests, we observed the drop of hops during platform rollout process as well due to the same reason described above. After we launched the fixed Docker image in early Jan, 2020, the number of hops jump back and expected to recover over time.
SELECT
ts,
COUNTIF(hop_ip IS NOT NULL) AS total_hops

FROM (
SELECT
  DATE(TestTime) as ts,
  hops.Source.IP AS hop_ip,
FROM  `measurement-lab.aggregate.traceroute` as traceroute,
     UNNEST(traceroute.Hop) as hops
WHERE
DATE(TestTime) BETWEEN DATE("2019-01-01") AND DATE("2020-01-31")
)
GROUP BY ts
ORDER BY ts ASC
We further compare the pool of NDT and the traceroute coverage for those tests by the UUID binding:
Number of new-platform download(S2C) tests during this time range that have a traceroute with the same UUID as the download(S2C) channel’s UUID:
SELECT COUNT(*) as total
FROM `measurement-lab.ndt.ndt5` as ndt5 INNER JOIN `measurement-lab.aggregate.traceroute` as troute on ndt5.result.s2c.uuid = troute.uuid
WHERE result.S2C IS NOT NULL
  AND ndt5.partition_date BETWEEN DATE("2020-01-10") AND DATE("2020-01-20")
  AND ndt5.result.S2C.uuid IS NOT NULL
  AND ndt5.result.S2C.uuid != ""
  AND ndt5.result.Control.uuid IS NOT NULL
  AND ndt5.result.Control.uuid != ""
  AND EXTRACT(DATE FROM troute._PARTITIONTIME) BETWEEN DATE("2020-01-10") AND DATE("2020-01-20")
  AND troute.uuid IS NOT NULL
  AND troute.uuid != ""
The output is 13,323,344. The total number of new-platform S2C tests during this time range:
SELECT COUNT(*) as total
FROM `measurement-lab.ndt.ndt5` as ndt5
WHERE result.S2C IS NOT NULL
  AND ndt5.partition_date BETWEEN DATE("2020-01-10") AND DATE("2020-01-20")
  AND ndt5.result.S2C.uuid IS NOT NULL
  AND ndt5.result.S2C.uuid != ""
  AND ndt5.result.Control.uuid IS NOT NULL
  AND ndt5.result.Control.uuid != ""
The output is 21,553,152. This indicates that 13,323,344 / 21,553,152 = 62% of tests have a corresponding traceroute.
We can further check how many unique client IPs from NDT tests covered by traceroute. If we set the time window as 2 days (2020/01/10 - 2020/01/11):
SELECT
COUNT(DISTINCT client_ip) AS num
FROM (
SELECT ndt5.result.s2c.ClientIP as client_ip
FROM `measurement-lab.ndt.ndt5` as ndt5
WHERE result.S2C IS NOT NULL
  AND ndt5.partition_date BETWEEN DATE("2020-01-10") AND DATE("2020-01-11")
  AND ndt5.result.S2C.uuid IS NOT NULL
  AND ndt5.result.S2C.uuid != ""
  AND ndt5.result.Control.uuid IS NOT NULL
  AND ndt5.result.Control.uuid != ""
)
Output is 1,526,624 unique IP from NDT tests within 2 days.
This is the unique IP of those NDT tests that also have a traceroute in the same time range:
SELECT
COUNT(DISTINCT client_ip) AS num
FROM (
SELECT ndt5.result.s2c.ClientIP as client_ip
FROM `measurement-lab.ndt.ndt5` as ndt5 LEFT JOIN `measurement-lab.aggregate.traceroute` as troute on ndt5.result.s2c.ClientIP = troute.Destination.IP
WHERE result.S2C IS NOT NULL
  AND ndt5.partition_date BETWEEN DATE("2020-01-10") AND DATE("2020-01-11")
  AND ndt5.result.S2C.uuid IS NOT NULL
  AND ndt5.result.S2C.uuid != ""
  AND ndt5.result.ClientIP IS NOT NULL
  AND ndt5.result.ClientIP != ""
  AND ndt5.result.Control.uuid IS NOT NULL
  AND ndt5.result.Control.uuid != ""
  AND EXTRACT(DATE FROM troute._PARTITIONTIME) BETWEEN DATE("2020-01-10") AND DATE("2020-01-11")
  AND troute.uuid IS NOT NULL
  AND troute.uuid != ""
  AND troute.Destination.IP IS NOT NULL
  AND troute.Destination.IP != ""
  )
The output is 1,078,092. That indicated that 1,078,092/1,526,624 = 70% unique IPs has a traceroute test in our dataset within 2 days.
If we reduce the window to one day (2020/01/10), the coverage is about the same: 579,229/814,794 = 70%
If we extend the time range from 2 days to 3 days (2020/01/10 - 2020/01/12), The coverage is 1,529,755/2,184,580 = 70% in this 3-day time range. So it is relatively stable that 70% client IPs have a traceroute in our database.
Overall, we can conclude that the new traceroute data set can be joined with corresponding NDT tests much more easily through UUID and BigQuery join tables. The number of tests are more than legacy test sets. And we will continue to make the traceroute data more reliable and easier to use for researchers and M-Lab partners.