M-Lab 2.0 Platform: Global Pilot Entry
For a while, we’ve been developing M-Lab 2.0 [1, 2]. This month, we are launching a global pilot for the new software stack. The changes include:
- Stock Linux 4.19 LTS kernels with modern TCP and Cubic congestion control
- Standard instrumentation for all experiments using tcp-info
- Virtualization and container management using Kubernetes and Docker
- Reimplementation of the NDT server
Since early 2019, we’ve run the new software stack on our staging machines (150 globally), directing 0.1% of production traffic to these machines to build confidence in client compatibility, system management, and performance. We consider the new kubernetes cluster and node software stack stable and ready for wider release.
Since early June, we’ve run a limited pilot on a small number of production machines. First we started in New York and Los Angeles. In July we added two more sites in Mumbai, and Amsterdam. From these trials, we’ve found that performance matches or exceeds the current software stack, and success rate for NDT clients has improved for browser-based clients while remaining compatible with most earlier NDT clients. Based on these measurements, we are launching the new software stack to one third of the production platform.
Of course, we’re not done evaluating the new software stack. Once the machines in the global pilot are upgraded, we will compare the performance of the current and new software stacks at every site for a few weeks. Once the criteria outlined below are met or deviations fully explained, we will conclude the pilot and complete the upgrade of all production machines.
Criteria for the NDT server
- Daily or weekly, per-site successful test counts should not decrease - total test counts, test counts per-protocol combination (i.e. wss+json, ws+json, plain+json, plain+tlv)
Criteria for the platform
- Daily or weekly, per-site performance deciles - up to some threshold, most deciles should not decrease on the new platform
Criteria for the ETL Pipeline
- measurement-lab.ndt BigQuery tables are public - the performance and error rate analysis described below can be replicated by you
Because the new software stack uses new instrumentation, we are collecting new data formats, building new parsers and BQ schemas for the new data formats. Not all of this is publicly available yet. So, the data below are a preview of what will be possible once the data is generally available.
Pilot Entry Criteria
The pilot entry criteria use two datasets: measurement-lab.ndt.web100 (public) and a new data type (not yet public) collected by the new NDT server. Both datasets allow the calculation of:
- Test start time
- Measured test rate
- Target server hostname
- Unique client source
- Client protocol
- Test duration
Using these values, we can evaluate all of the criteria above for uploads and downloads.
Test Counts
Clients are randomly directed to M-Lab servers at a site by the M-Lab location service. So, if all servers at a site are healthy, then we would expect all three to receive about the same number of tests over the same time period. For our analysis, all machines at each site were nominally healthy.
Our methodology for comparing aggregate test counts:
- Select the fastest test per IP over the time window (1 day or 1 week).
- Round web100 rates to an integer number of websocket messages to emulate the new NDT server.
- Exclude tests with duration <= 9 sec (a normal test is 10 sec)
- Exclude tests with rate == 0
- Finally, group by hour and hostname to get the test count
The images below use data from AMS03. We see similar trends from all sites. Detailed graphs from all sites are available here: ams03, bom02, lga03, lax02.
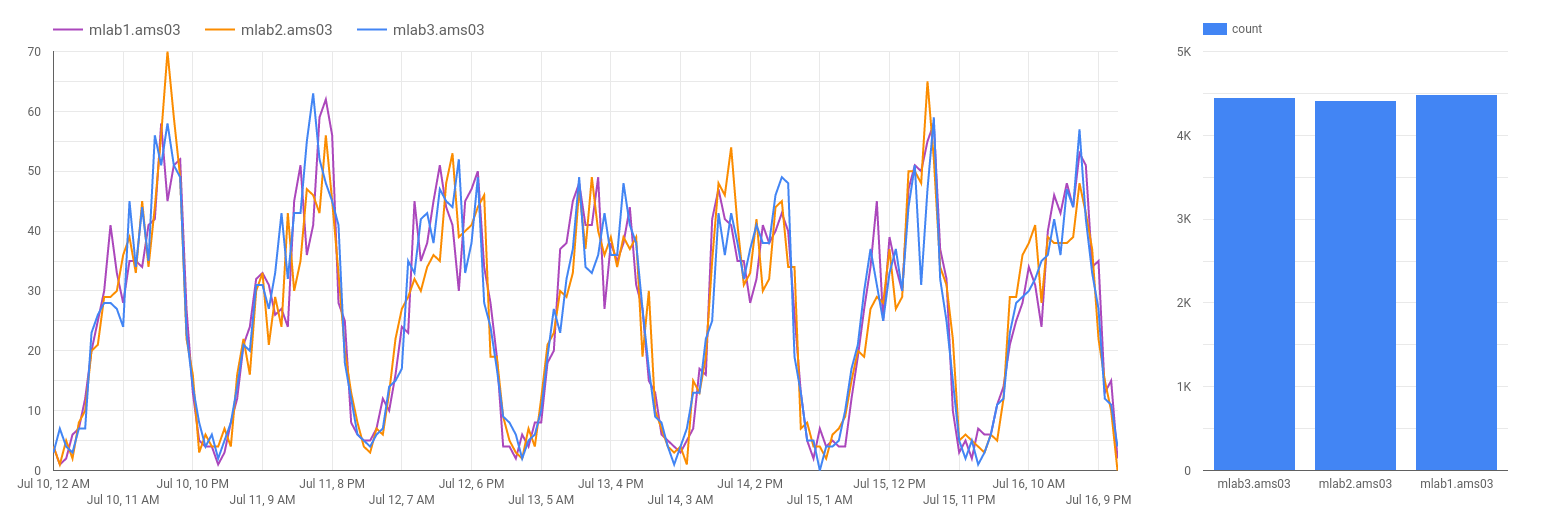 Test Counts Before Upgrade: Before upgrading any machine to the new platform, all machines (mlab1, mlab2, & mlab3) record roughly the same rate of download tests (less than 2% difference over the week).
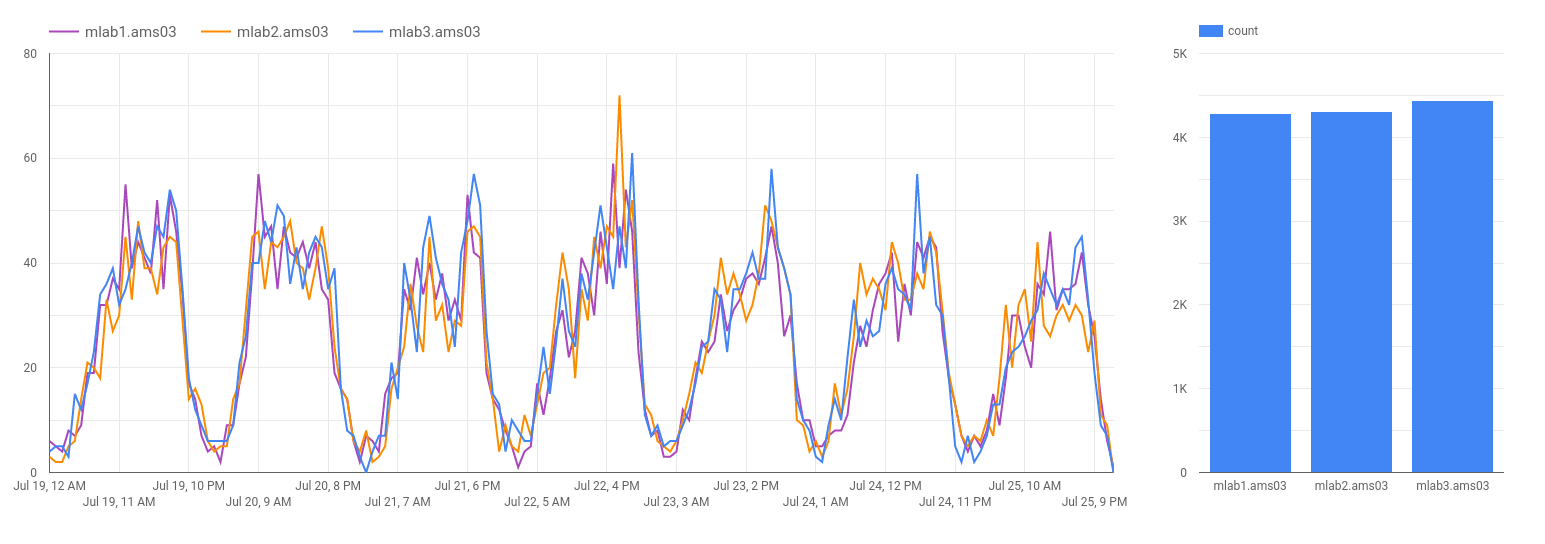 Test Counts After Upgrading mlab3: NDT test rates increased slightly (~3%). When breaking down all tests by client type, we found that the new NDT server handles WSS+JSON clients better than the web100 NDT server.
Test Performance Distributions
The web100 platform uses the TCP Reno congestion control algorithm while the new platform uses TCP Cubic. We want to verify that typical performance is not affected by this change. NDT is the first experiment running on the new platform. The test count analysis above shows that at least as many tests are recorded. So below, we use the NDT test rates as representative of platform performance.
Our methodology for comparing current and new platform performance
- Select the fastest test per IP over the time window (1 day or 1 week)
- Round web100 rates to an integer number of websocket messages to emulate the new NDT server
- Exclude tests with duration <= 9 sec (a normal test is 10 sec)
- Exclude tests with rate == 0
- Include only tests using the WSS+JSON protocol (the most popular)
- Group by day and hostname, and calculate the deciles of all measurements in group
- For each day, scatter plot performance deciles from the current and new platform
The images below use data from AMS03. We see similar trends from all sites. Detailed graphs from all sites are available here: ams03, bom02, lga03, lax02.
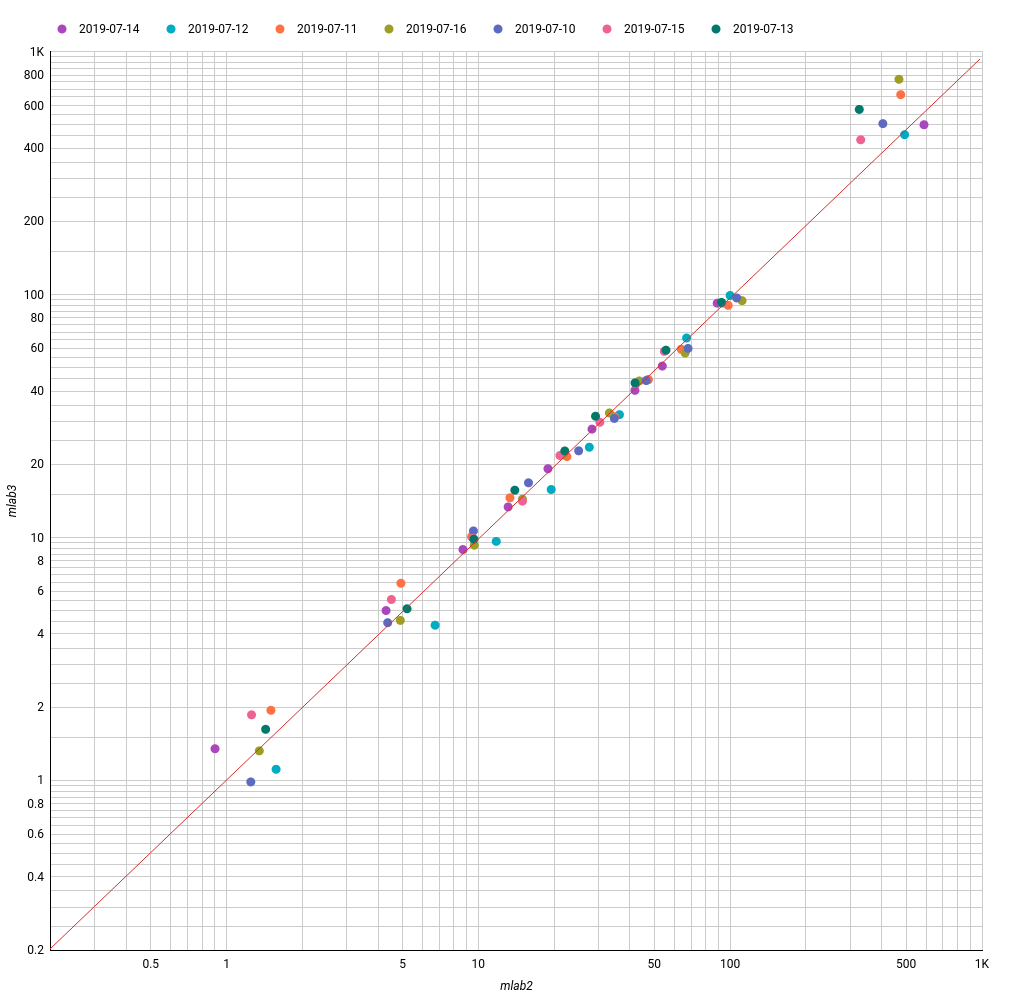 Deciles per-Day Before Upgrade: Before the upgrade, we expect typical traffic to follow the x=y trendline with minor variations. This analysis compares the web100 (mlab2 & mlab3) dataset from two machines at the same site to one another. The minor variation is a result of variable client performance and that a single client contributes a single measurement.
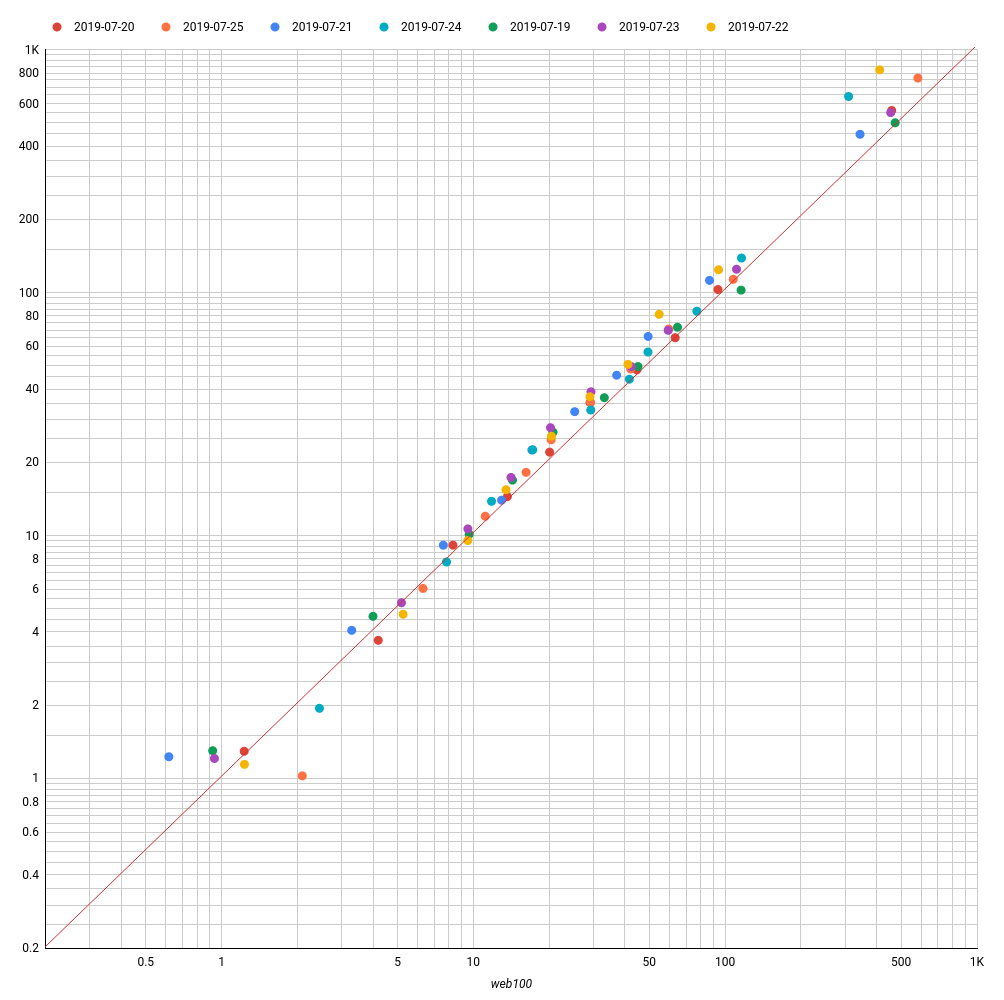 Deciles per-Day After Upgrade at AMS03: Daily deciles between web100 (mlab2) ndt5 (mlab3) at AMS03. If performance between the two systems were identical, then the decile curves would fall exactly on the trendline. We find most variation in the lowest and highest deciles. The lowest decile includes measurements most affected by message size rounding, and the highest decile includes less frequent measurements. The intermediate deciles align nicely with the trendline with slight bias toward the new platform.