Measurement Observations on Network Performance During the COVID-19 Pandemic in Northern Italy
OONI was recently invited to participate in a NetGain Partnership webinar (titled “Surging Demand and The Global Internet Infrastructure”) to discuss the changing landscape for internet infrastructure and technology in the wake of the COVID-19 pandemic.
As part of our preparation for this webinar, we looked at network performance measurements collected from northern Italy over the last months (i.e. when Italy was hit hard by the COVID-19 pandemic) in an attempt to understand whether and to what extent there was a correlation between increased internet use and reduced network performance. As our observations may be of public interest, we decided to share them through this blog post.
In summary, we observe:
- Significant increase in the number of NDT tests run per day around the beginning of Italy’s nationwide lockdown (which started on 10th March 2020);
- Reduced NDT download and upload speed results during the nationwide lockdown in Italy (between March 2020 to May 2020);
- Improved NDT download and upload speed results from early May 2020 onwards, when the Italian government gradually started to lift the strict lockdown measures.
Further details are shared through this report.
The NDT speed test
The Network Diagnostic Test (NDT){;target=”_blank”} — originally developed by The Internet2 Project and currently maintained by Measurement Lab (M-Lab) — is designed to measure the speed and performance of networks and to collect data useful to diagnose performance issues.
Several integrations of the NDT measurement methodology exist. The most widely used one is run by Google. Users searching for “internet speed test” or “how fast is my Internet” in selected countries and networks are offered the possibility of running NDT as part of the search results, without visiting third party websites. OONI also utilizes an implementation of NDT, integrated in both the OONI Probe mobile and desktop apps. In all of these cases, tests are always user-initiated.
While many people visit a website to run a test, or search for a test on Google, or use OONI Probe, many other users also choose to run automatic tests periodically using NDT client software running from a computer in their network. There are cohorts of these long-running clients that periodically run NDT. These clients act as “beacons” illuminating the evolution of internet performance, because it is possible to track their progress (or regress) over time.
Access to NDT servers is mediated by M-Lab’s Locate services. Clients access the Locate services to obtain a list of suitable nearby NDT servers. In turn, servers are placed in data centres where ISP networks interconnect their consumer-facing networks to the internet. This type of server placement is called “off-net” because the server is almost always outside of the network it is measuring. Video caches are often — but not always — deployed inside your ISP (as documented, for example, in OONI’s 2019 Jordan report). Otherwise, the architecture of the internet is such that when you access content your request typically passes through an interconnection point between your ISP and some other ISP or content provider. Because M-Lab’s measurement servers are placed in popular data centres and because the Locate service returns one of the nearby NDT servers at random, repeated runs of NDT measure the quality of the path (including interconnections) between the user’s device and a number of popular nearby data centers.
In the specific cases of running NDT measurements near Milan, there are four groups of NDT servers there because it is a major hub of the Italian internet. These servers are hosted by Google inside a large data centre in Via Caldera, 21 Milan. Each server group is attached to a different upstream provider. These providers are Telia, GTT, Level3, and Vodafone.
Because NDT measures a long path including possibly the user’s Wi-Fi network and the ISP’s interconnection with a data centre, its measurements do not necessarily confirm the speed advertised by the ISP. Of course, this happens because the ISP advertises the speed of just a portion of the path measured by NDT, the access link. Therefore, factors not under the control of the ISP (e.g. Wi-Fi interference) would impact NDT measurements as it would impact, for example, a video call. A second reason why it is incorrect to use NDT measurements to evaluate the access link capacity is that the speed advertised by the ISP for the access link describes the maximum bitrate of the access link, while NDT measures the “bulk transport capacity” — the ability of TCP to deliver the data over the whole path while adhering to Internet standard conventions for congestion control.
On this note, NDT uses a single TCP connection. This choice makes it less robust to network congestion or interference, hence more sensitive to network issues. While modern web browsers will use multiple streams of data, testing for multiple streams can compensate for data delivery problems that are exposed by a single stream. A multi-stream test can return measurements closer to link capacity but it would not represent the adverse performance impact of low-level packet loss. By testing for single-stream performance, NDT is thus an effective baseline for measuring a user’s Internet performance.
The drawback of NDT’s approach is that a single measurement result is usually not enough to evaluate the overall performance of a network. Rather, it is necessary to examine measurements (collected from the same network) in bulk over a longer period of time in order to better characterize the performance of a network. This is probably one of the reasons why tech savvy users configure NDT to run periodically from their vantage points. (On this note, M-Lab has developed the Murakami tool specifically to address this usage case by allowing anyone to run automated measurements from a Docker container.)
Lastly, we should mention that user-initiated measurements possibly have a self-selection bias problem. As people are often more incentivised to run tests when the performance of their internet connection is not great, most measurements could possibly be run by users with a bad internet connection. As a result, NDT measurements may potentially show a worse-than-real picture, because we cannot exclude the hypothesis that users with a good internet connection may not be running NDT tests as often as users with issues.
Data analysis
In an attempt to understand whether network performance was impacted by the surge in demand in northern Italy amid the COVID-19 pandemic, we analyzed all NDT measurements collected in the provinces in the Milan metropolitan area.
Our data analysis involved NDT measurements collected between 1st January 2020 to 15th June 2020. This period was selected because it would enable us to examine whether network performance in the region was affected before, during, and after the peak of the COVID-19 pandemic in March 2020. The analysis was performed on 7th July 2020.
To fetch and analyze NDT measurements, we used M-Lab’s public BigQuery tables. We ran the following query to extract information pertaining to the upload speed and a similar query to extract download information.
-- pull the names of the italian provinces
-- note: the global_gadm36_2 table isn’t publicly advertised. It was pulled
-- from https://gadm.org and allows us to use BigQuery's GIS functions to
-- determine the province name for each NDT test. The M-Lab team is
-- currently testing this table and will make it generally available when
-- satisfied with testing it in more research reports.
with provinces AS (
  SELECT * FROM `measurement-lab.geographies.global_gadm36_2`
  WHERE NAME_0="Italy"
),

-- pull the results for each client IP in each province
-- note: change uploads to downloads to obtain download results
per_ip AS (
  SELECT
    tests.a.MeanThroughputMbps AS mbps,
    NET.SAFE_IP_FROM_STRING(tests.Client.IP) AS ip, tests.test_date,
    provinces.NAME_2 AS province,
  FROM `measurement-lab.ndt.unified_uploads` tests, provinces
  WHERE test_date >= "2020-01-01"
  AND test_date <= "2020-06-15"
  AND ST_WITHIN(
        ST_GeogPoint(
              client.Geo.longitude,
              client.Geo.latitude
        ), provinces.geom
      )
)

-- compute buckets and limit results to the Milan metropolitan area
SELECT test_date,
  -- renard series R5: 1.00, 1.60, 2.50, 4.00, 6.30, 10.00
  SUM(IF(mbps < 1, 1, 0)) / COUNT(*) AS LessThan1,
  SUM(IF(mbps < 1.6, 1, 0)) / COUNT(*) AS LessThan1_dot_6,
  SUM(IF(mbps < 2.5, 1, 0)) / COUNT(*) AS LessThan2_dot_5,
  SUM(IF(mbps < 4, 1, 0)) / COUNT(*) AS LessThan4,
  SUM(IF(mbps < 6.30, 1, 0)) / COUNT(*) AS LessThan6_dot_30,
  --
  SUM(IF(mbps < 10, 1, 0)) / COUNT(*) AS LessThan10,
  SUM(IF(mbps < 16, 1, 0)) / COUNT(*) AS LessThan16,
  SUM(IF(mbps < 25, 1, 0)) / COUNT(*) AS LessThan25,
  SUM(IF(mbps < 40, 1, 0)) / COUNT(*) AS LessThan40,
  SUM(IF(mbps < 63, 1, 0)) / COUNT(*) AS LessThan63,
  --
  SUM(IF(mbps < 100, 1, 0)) / COUNT(*) AS LessThan100,
  SUM(IF(mbps < 160, 1, 0)) / COUNT(*) AS LessThan160,
  SUM(IF(mbps < 250, 1, 0)) / COUNT(*) AS LessThan250,
  SUM(IF(mbps < 400, 1, 0)) / COUNT(*) AS LessThan400,
  SUM(IF(mbps < 630, 1, 0)) / COUNT(*) AS LessThan630,
  --
  SUM(IF(mbps < 1000, 1, 0)) / COUNT(*) AS LessThan1000,
  count(*) AS count,
FROM per_ip
WHERE ip IS NOT NULL AND (
  province = "Milano" OR
  province = "Bergamo" OR
  province = "Varese" OR
  province = "Monza" OR
  province = "Como" OR
  province = "Pavia" OR
  province = "Novara" OR
  province = "Lecco" OR
  province = "Lodi"
)
GROUP BY test_date
ORDER BY test_date
The SELECT clause of the query computes the number of cases in which a test result is lower than a specific threshold. The thresholds were chosen using the Renard R5 series, which divides each decade in five buckets. For example, given a 5 Mbit/s result, the above query would count such a result inside the following buckets: slower than 1 Mbit/s, slower than 1.6 Mbit/s, slower than 2.5 Mbit/s, and slower than 4 Mbit/s.
You can perform a similar analysis by following the instructions to access the M-Lab dataset via BigQuery and by modifying the above query. You can export results to Google drive and then analyse them using Google Sheets to produce plots.
Number of tests per day
The following chart shows the number of download and upload NDT tests performed per day.
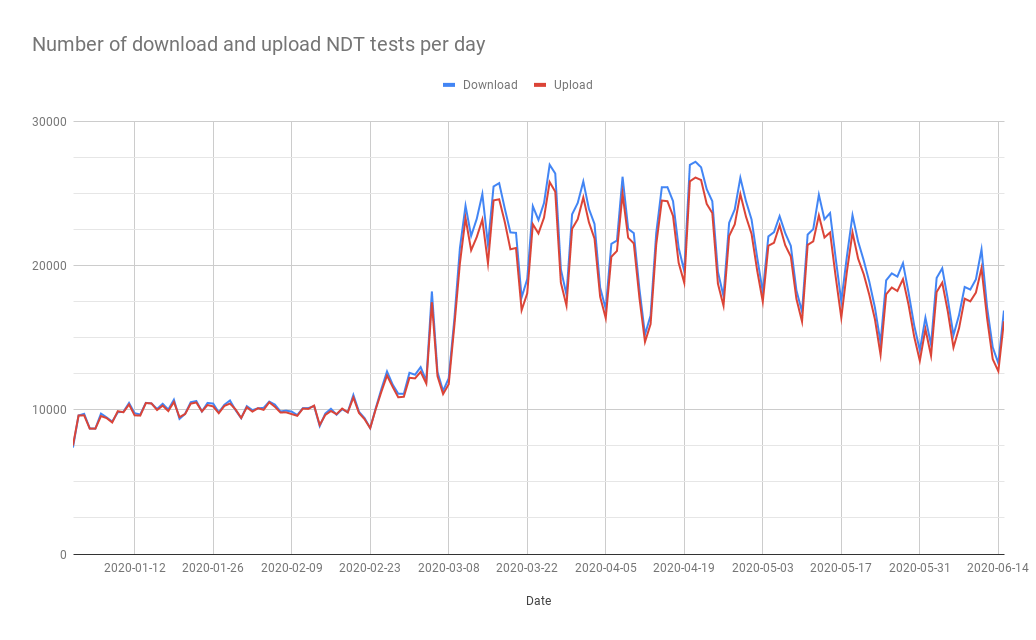
It is evident that the number of tests per day surges after 23rd February 2020, which is two days after the announcement of the “red zone” that placed some municipalities in the province of Lodi under lockdown, along with other provinces in Veneto (not covered in this analysis). We also observed a spike in tests run since 10th March 2020, after the central Government placed under lockdown most provinces in the North of Italy and subsequently extended the lockdown to the whole country.
The number of tests per day has doubled during the first week of the lockdown. We can also see that the number of tests run begins to decrease (with obvious weekly patterns) around the same time when the lockdown measures were progressively softened by the central Government (May 4th, 2020). The increase in the number of tests has also been observed in previous research by M-Lab, who documented increases in the number of tests per day, both worldwide and in selected areas (New York and São Paulo).
We currently do not have a good explanation of why the number of upload tests is lower than the number of download tests. When we asked M-Lab about this, they mentioned that this is a common pattern across M-Lab data, likely due to the fact that some people stop testing after they get the download rate (they are not as interested in the upload rate). This is also enabled by the fact that the download test runs first in their largest integration (Google’s OneBox).
Download speed
The following chart shows the evolution over time of the percentage of tests for which the measured download speed was lower than a given speed in Mbit/s. When the curve increases, it means that more tests were slower in percentage than before. When it decreases, it means that more tests were faster in percentage than before.
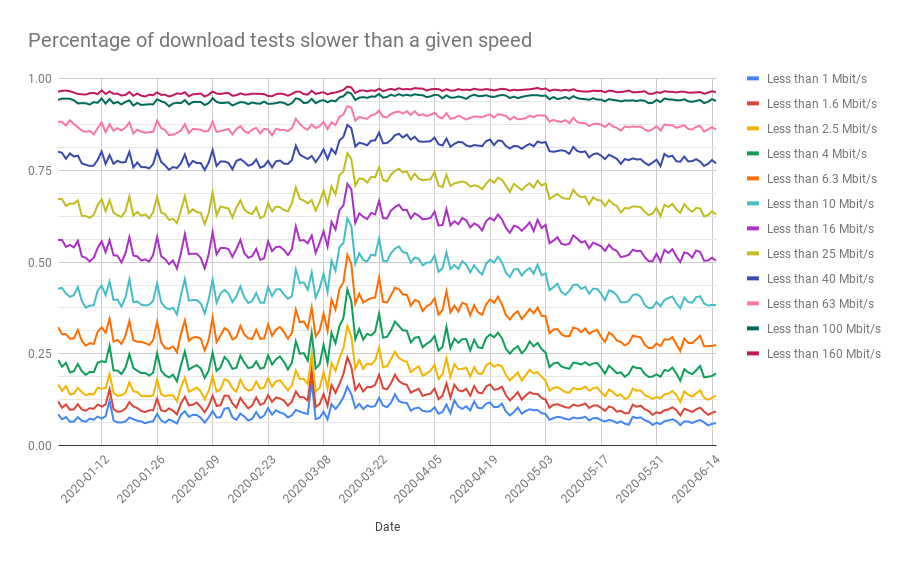
Before Italy’s nationwide lockdown, we observe weekly patterns. For example, we notice that the measured performance is worse on weekends, as suggested by measurements collected on 26th January 2020 and 9th February 2020 (both Sundays), in comparison to other days. It remains unclear if this change is related to changes in the population that runs tests, as this would probably require performing beacon analysis.
Since 8th March 2020, right before Italy’s nationwide lockdown (which started on 10th March 2020), we observed that the percentage of tests measuring high download speeds is significantly reduced (i.e. the curves go up in the plot). This could potentially be correlated to increased internet usage during those days, as a result of the lockdown. Throughout March 2020 (which is when the COVID-19 pandemic was at its peak in Italy), we see that the measured download speeds remained at reduced levels. Overall, the measured performance starts improving in late April 2020 and the download speeds returned to (more or less) the pre-lockdown levels in early May 2020, which coincides with the gradual lifting of strict lockdown measures in Italy.
We cannot exclude the hypothesis that the changes in the performance depend chiefly on the changing population of users running NDT tests. The drop in performance during the lockdown could also be caused by Wi-Fi interference, more users using the home network concurrently, and congestion inside ISPs’ networks or at interconnection points with upstream ISPs. The best way to refine this analysis is probably to identify beacons and monitor their performance over the lockdown time period. It would also be interesting to perform a follow up analysis where we break down the results by province and by ISP.
An NDT result lower than 2.5 Mbit/s indicates that that specific user would likely not have been able to perform a Google Meet group video meeting with great quality, if the Google Meet server was located at the same location as the M-Lab server that we used (as part of the testing). In fact, Google Meet’s documentation mentions that the ideal average bandwidth for such a meeting is 3.2 Mbit/s in download and upload. Yet, we have no way of knowing whether other video chat meetings or video streamings or video gaming sessions were active in the moment in which the NDT test was run. The same documentation also recommends using the 5 GHz Wi-Fi band where possible, because this has generally less interference and results in better performance.
Upload speed
The following chart shows the evolution over time of the percentage of tests for which the measured upload speed was lower than a given speed in Mbit/s. When the curve increases, it means that more tests were slower in percentage than before. When it decreases, it means that more tests were faster in percentage than before.
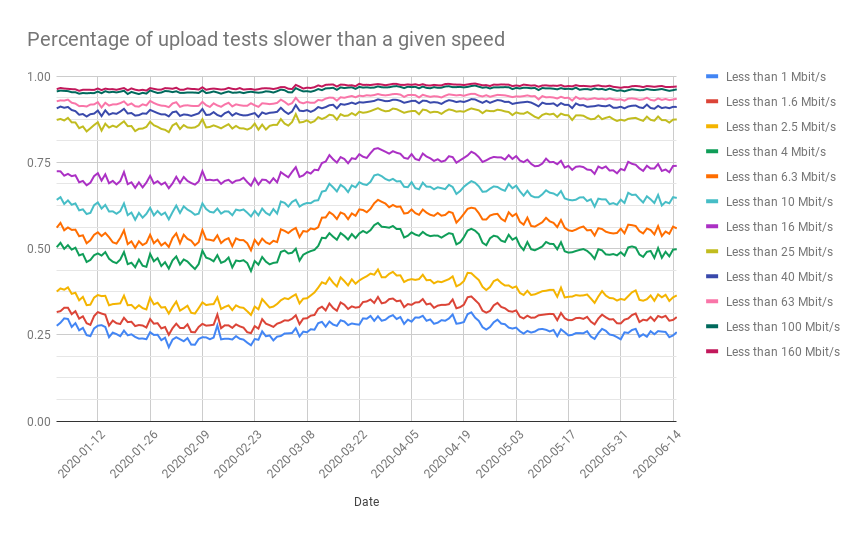
Through the above chart, it is suggested that few NDT users have access to high upload speeds. This is quite likely explained by the asymmetric distribution of bandwidth between download and upload in Italy, but it is also influenced by the population of users that run NDT tests. Anecdotally, one of the authors of this report (Simone Basso) used to have a Fiber To The Home (FTTH) Vodafone access link providing 1 Gbit/s in download and 200 Mbit/s in upload. Now, after moving to a less well-provisioned area in Italy, it is Fiber To The Node (FTTN) with 100 Mbit/s in download and 20 Mbit/s in upload.
Similarly to the download test results, we observe worse performance during the lockdown period, as the fraction of tests measuring high upload speeds is reduced in comparison to the pre-lockdown measurements. However, we cannot exclude the hypothesis that the changes in the performance depend chiefly on the changing population of users running NDT tests. The drop in performance during the lockdown could also be caused by Wi-Fi interference, more users using the home network concurrently, and congestion inside ISPs’ networks or at interconnection points with upstream ISPs. The best way to refine this analysis is probably to identify beacons and monitor their performance over the lockdown time period.
Whatever the cause of low performance in the moment in which the upload tests were run, we see that in many cases there was no extra bulk transport capacity for performing a video streaming meeting with high quality, if the servers were placed near the NDT servers. Of course, this statement is only valid for the moment in which tests were run, and for these specific users, as it would be incorrect to generalise and interpret the values in the chart as probabilities.
Conclusion
Our analysis of NDT measurements collected from the Milan metropolitan area between 1st January 2020 to 15th June 2020 suggests that there is a correlation between reduced network performance (i.e. reduced download and upload speeds) measured using NDT and the peak of the COVID-19 pandemic in Italy (which may have resulted in increased internet use and congestion because of people working from home, studying from home, or more generally streaming videos from home during the lockdown).
More specifically, we observe a surge in the volume of NDT tests run following the announcement of north Italy’s “red zone” in February 2020, as well as a larger spike following the nationwide lockdown on 10th March 2020. Throughout the lockdown, more than double the amount of NDT tests (in comparison to previous months) were run from northern Italy, but we observe reduced download and upload speeds during this period. Following the lifting of the nationwide lockdown in June 2020, we observe speeds in line with pre-lockdown results.
As the available measurements suggest that there may be a correlation between increased internet use and reduced network performance, they highlight the need to invest in internet infrastructure that is more robust and sustainable in the long-term. They also highlight the need for more longitudinal measurements collected from more stable vantage points to improve our understanding of network performance issues.
Running NDT tests every day, regardless of your experience of your internet connection, is important, because the results are openly published, enabling researchers and technologists to better understand issues around network performance and build solutions. You can run NDT and contribute measurements on network performance through the OONI Probe apps or by deploying the Murakami tool in a Docker container.