An Overview of M-Lab’s Traceroute Data
Summary
This blog post is a report on M-Lab’s traceroute data so the community can have a better understanding of what the data we make available includes.
The scope of this report is limited to traceroute data generated by traceroute-caller running as a sidecar service of NDT measurements and published as scamper1 datatype.
The path for M-Lab’s traceroute data is from the M-Lab server that ran an NDT measurement back to the client that initiated the measurement. M-Lab servers connect to transit ISPs and clients tend to be end users. Since the server for an NDT measurement is chosen to be geographically close to the client, we expect that M-Lab’s traceroute paths will be relatively short.
Traceroute data generated by (1) traceroute-caller running as a sidecar service of Host and Neubot measurements and (2) legacy traceroute data generated by paris-traceroute are not in the scope of this report. Also, how traceroutes work and what algorithms the tools use are beyond the scope of this report (you can visit this wikipedia article to learn about traceroutes).
Background
Since May of 2013, M-Lab has been collecting traceroute data from its servers to clients that connect to the servers. This data is archived in Google Cloud Storage, parsed into BigQuery, and made publicly accessible. For details see the Traceroute page on M-Lab’s website.
For a period of about six years, the paris-traceroute tool was used to run traceroutes. However, because paris-traceroute had several issues (see these blog posts) and was not actively maintained, in April 2019 M-Lab switched to the scamper tool from CAIDA and a few months later, in January 2020, announced the switch in a blog post. Historical traceroute data generated by paris-traceroute can still be accessed in ndt_raw.paris1_legacy.
The tcp-info package running on M-Lab nodes triggers a traceroute by notifying traceroute-caller about every TCP connection to the node regardless of the reason for the connection.
Every NDT5 measurement makes three TCP connections: one for control, one for download, and one for upload. Every NDT7 measurement makes two connections: one for download, and one for upload. Therefore, traceroute-caller is triggered two or three times in a row for the same destination IP address. The first trigger causes an actual traceroute run (unless it’s already in the cache) while subsequent triggers are almost always served from the cache. Traceroute measurements were designed to associate a test UUID with a traceroute UUID. So, in exchange for duplicate data, we guarantee every upload and download test has an associated traceroute.
Overview
As of this writing, M-Lab generates about 14 million traceroutes per day and has more than 8 billion rows of scamper1 datatype in the measurement-lab.ndt_raw.scamper1 table from about 480 million unique destination IP addresses. Individual traceroute files are saved in compressed archives in a Google Cloud Storage bucket that is publicly accessible. Currently, there are about 10 million compressed archives, each containing about 800 individual traceroutes taking up a total storage of about 4TB.
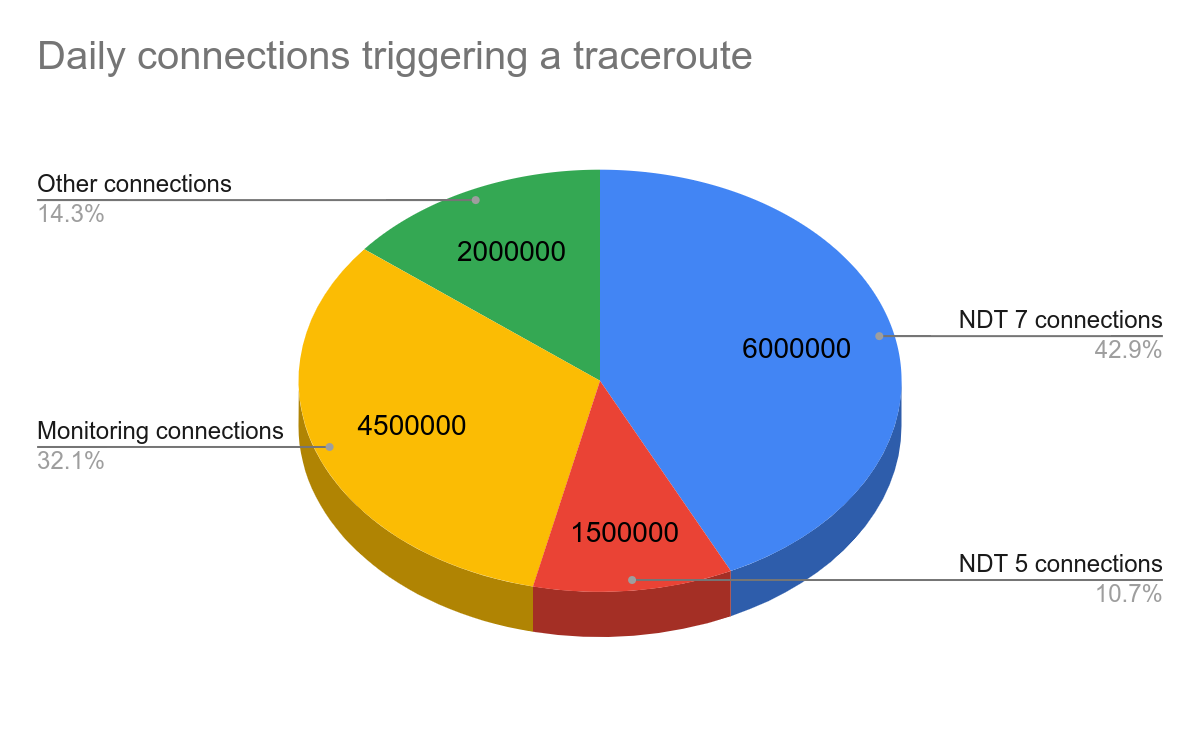
The chart below shows:
- Roughly half of the 14M daily traceroutes are triggered by 7.5M daily NDT measurements (1.5M NDT5, 6M NDT7).
- Based on our initial estimate that at least 31% of all traceroutes is operational data, about 4.5M traceroutes are of limited value (operational data is generated due to various monitoring connections continuously checking the health of M-Lab nodes.
- We call the remaining 2M traceroutes “ambient” data. Ambient data is data triggered by TCP connections to M-Lab servers that are neither for measurement services nor for monitoring.
Of the 14M traceroutes generated every day, only about 30% are actual traceroute results; about 70% are cached results. Currently cached results are configured to be purged after 10 minutes. As explained earlier, NDT5 and NDT7 measurements generate three and two traceroutes respectively so about ⅔ of NDT5 traceroutes and ½ of NDT7 traceroutes are cached results. Therefore, we generate about 3.5M actual traceroutes per day (6M x ½ + 1.5M x ⅔) triggered by NDT tests. The chart below shows the overall number of actual versus cached traceroutes.
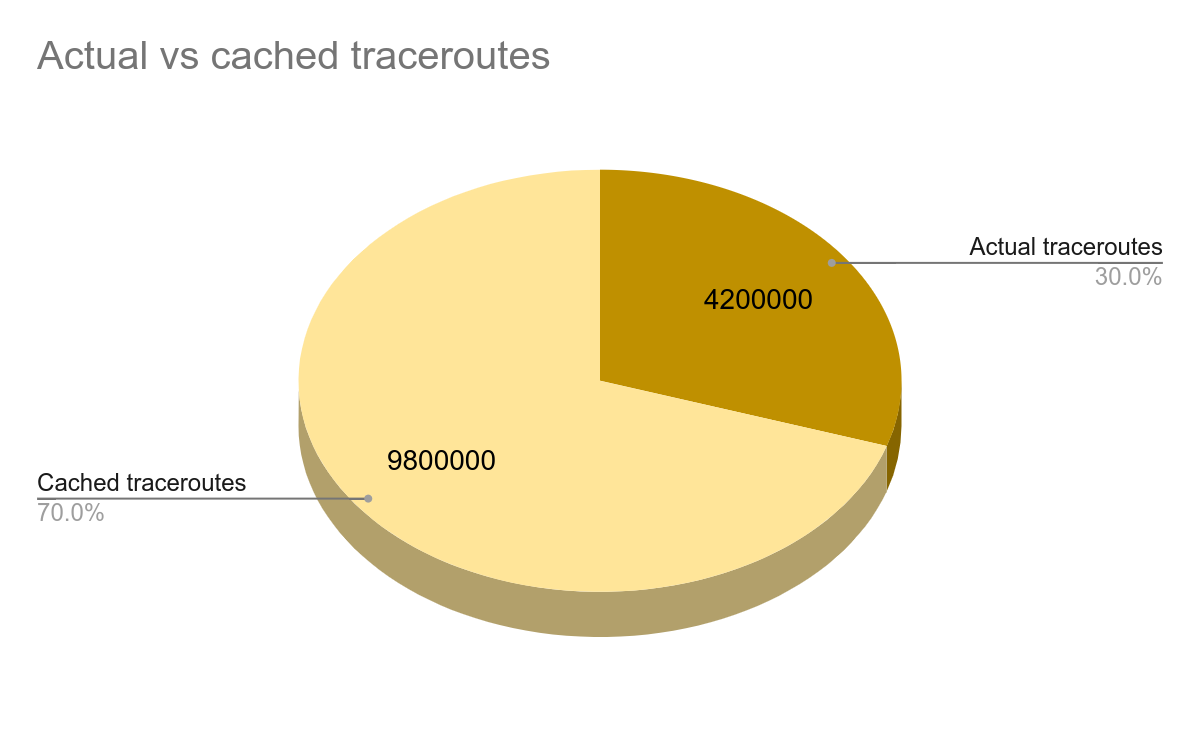
Because cached traceroutes are identical to actual traceroutes (other than the metadata line), they do not provide additional information and are considered duplicates.
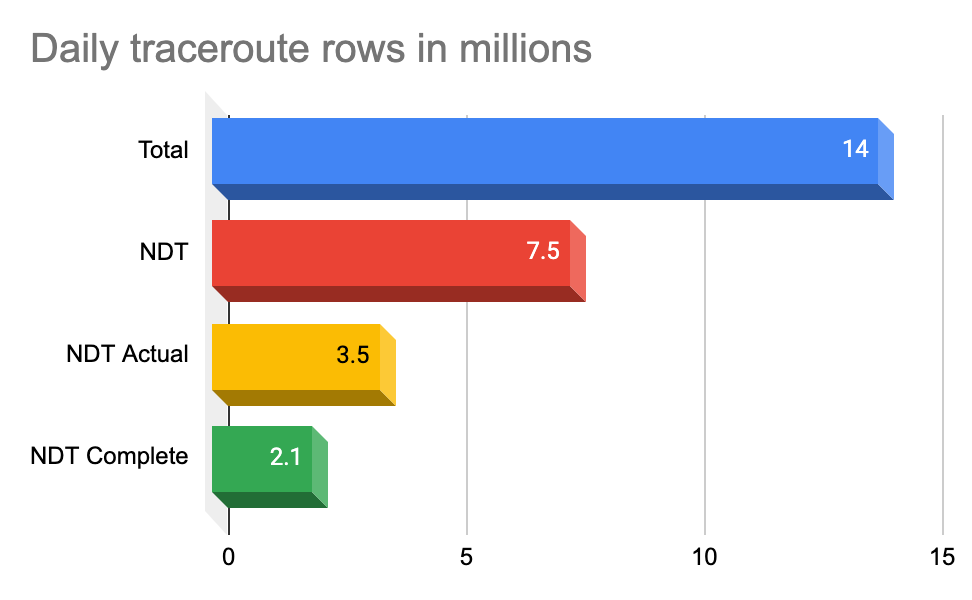
Finally, note that not all traceroutes make it all the way to the destination. Our early analysis shows that about 40% of traceroutes do not reach their destination and, therefore, are “incomplete”.
In summary, if we define the lower bound of “most valuable” traceroutes as the percentage of complete nonduplicate traceroutes triggered by NDT and the upper bound as the percentage of actual nonduplicate traceroutes triggered by NDT, then we have about 2.1M to 3.5M nonduplicate traceroutes per day.
M-Lab Traceroute Data
To get an overall picture of traceroute data, we can examine the charts below that cover the entire range from April 2019 to April 2022. The first chart shows the number of traceroutes run on a daily basis. The second chart shows minimum, maximum, and average durations in seconds.
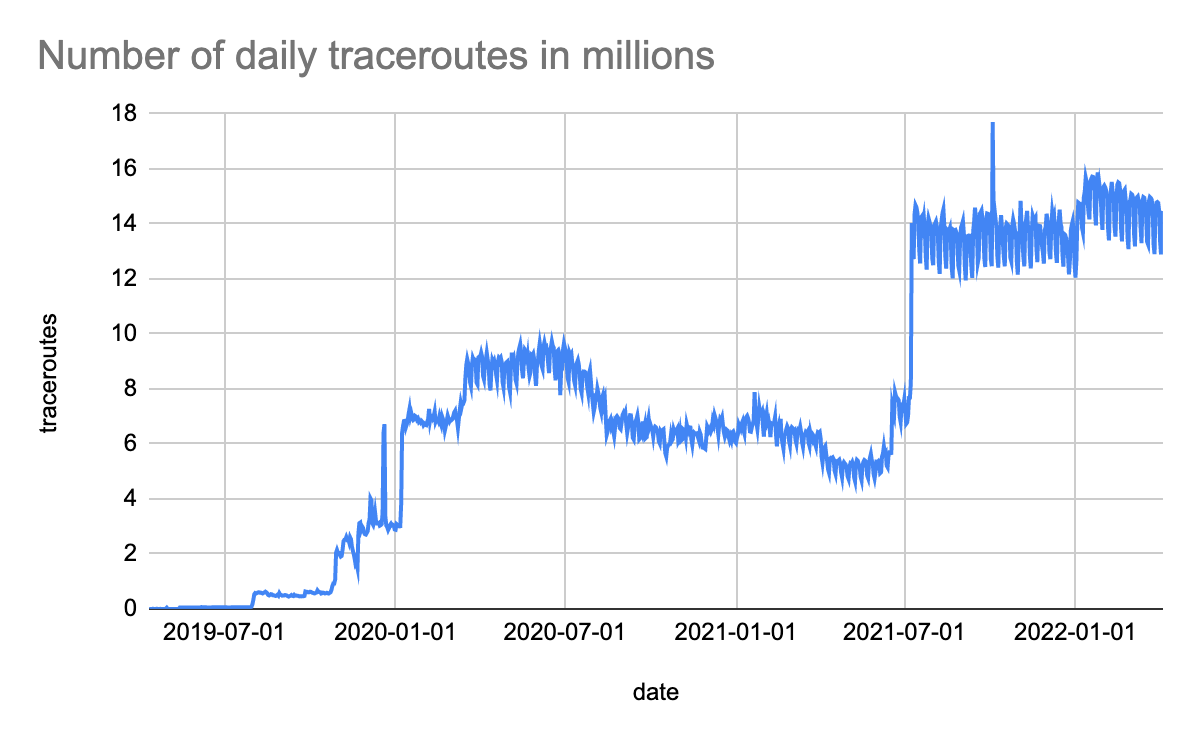
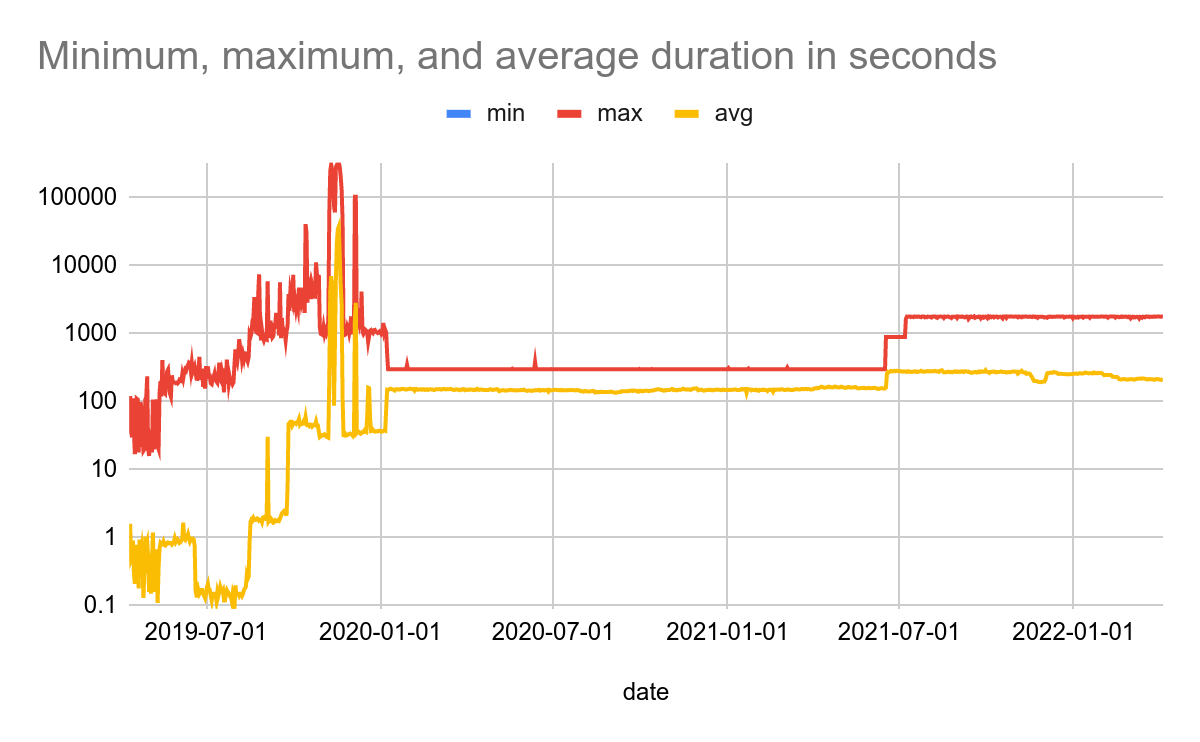
As it can be seen in the above charts, up until the beginning of 2020 the results are jittery and a small faction is unreasonable. For example, there are traceroutes in November and December 2019 with durations between 200,000 and 300,000 seconds (~3-4 days). These anomalies are related to the early versions of traceroute-caller when it was being debugged.
In December 2019, a default timeout value of 300 seconds (5 minutes) was introduced in traceroute-caller that contributed to more stable results starting in January 2020. However, in June 2021, we noticed many traceroutes were timing out. We increased the default timeout value from 5 to 15 minutes and even to 30 minutes but these changes didn’t make much difference. A deeper look at how traceroute-caller interfaced with scamper revealed that the set up was overly complex because traceroute-caller invoked scamper in daemon mode and queued requests via scamper’s sc_attach tool. This complexity lead to long delays in processing the queued requests which eventually caused timeouts and truncated (invalid) traceroutes.
As the chart of daily traceroutes shows, starting with traceroute-caller v0.8.0 (one scamper invocation per traceroute) that was pushed to production on July 8, 2021, the number of successful traceroutes has doubled and there aren’t truncated (invalid) traceroutes like before anymore. The spike on October 4, 2021, is due to the Facebook outage. Currently, the timeout value for a traceroute is set to 30 minutes but most of the traceroutes finish in less than 4 minutes.
Traceroute files
A traceroute file is a JSON Lines (“.jsonl”) file that contains a metadata line generated by traceroute-caller followed by three lines generated by scamper as follows:
- Line 1: metadata (generated by
traceroute-caller) - Line 2: cycle-start (generated by
scamper) - Line 3:
tracelb(generated byscamper) - Line 4: cycle-stop (generated by
scamper)
The notion of a cycle is somewhat outdated and goes back all the way to around 2003 when the idea was that scamper would do cycles across the same set of addresses over time (more information).
The tracelb line holds all data related to a traceroute run. The tracelb command is used by scamper to infer all per-flow load-balanced paths between a source and destination. traceroute-caller specifies the following options for tracelb when it invokes scamper :
tracelb -P icmp-echo -q 3 -W 15 -O ptr
The -P option specifies which method to use for probing. Valid options are: “udp-dport”, “icmp-echo”, “udp-sport”, “tcp-sport”, and “tcp-ack-sport”.
The -q option specifies how many probes to send in an attempt to receive a reply.
The -W option specifies in 1/100ths of seconds how long to wait between probes.
The -O option enables Domain Name System pointer (PTR) record lookups for IP addresses.
You can see all tracelb options on scamper man page