The Internet Can Be Up and Still Fail: Introducing HERMES
HERMES turns user-initiated M-Lab speed tests into an open, path-aware view of Internet slowdowns — helping operators, researchers, and policymakers see not only that performance changed, but where along the route the problem may be.
HERMES is joint work with collaborators Kevin Vermeulen, Dave Choffnes, Ethan Katz-Bassett, and Phillipa Gill.
Public Internet observatories typically focus on outages: events in which networks or services become unreachable and produce visible changes in reachability, routing, or traffic.
Loss of connectivity, however, is only one form of Internet failure. A network may remain reachable while rising latency or faltering throughput makes online applications unusable. Because these degradations do not result in loss of connectivity, outage-focused observatories may miss them.
Observing these degradations requires a different approach that measures end-to-end performance instead of monitoring reachability and routing changes. M-Lab’s Network Diagnostic Tool (NDT) provides end-to-end performance data from real user connections at scale. Each user-initiated speed test measures latency, throughput, and loss between a user’s device and an M-Lab server, producing millions of observations across networks and locations each day. While individual tests can reflect local conditions, M-Lab’s large data set of comparable tests can reveal broader performance problems.
M-Lab also collects complementary network-path measurements, including traceroutes and reverse traceroutes, that provide information about the infrastructure traversed by these connections. By combining performance measurements with path information, we can identify network segments shared by affected users and localize whether a degradation is associated with the access network, an interconnection, a transit network, or infrastructure near the destination.
We call our system that detects and localizes performance problems using M-Lab speed test data: HERMES. It is the first public system to quantify performance degradations at scale based on fully open data.
From individual speed tests to evidence of a wider problem
One slow speed test indicates that an end-to-end connection performed poorly but does not give us enough evidence to identify problems with the wider network. A single poor performing test may reflect a problem with the user’s Wi-Fi, device, background traffic, or service plan, which will not impact other network users. Conditions inside individual homes vary independently and are unlikely to deteriorate simultaneously, whereas congestion or failure in shared infrastructure is likely to produce a common change across many connections. HERMES, therefore, looks for performance changes that are consistent across multiple users with similar network contexts.
To identify these shared changes, HERMES groups tests from users in the same access network and metropolitan area that connect to the same M-Lab site. The access network is represented by its Autonomous System Number, or ASN. This grouping holds three important factors relatively constant: users’ access network, location, and test destination. It also increases the likelihood that the tests traverse the same network infrastructure. Grouping cannot eliminate local noise, but it makes changes affecting shared infrastructure easier to distinguish from isolated problems affecting individual users.
HERMES analyzes a group only when it has enough data to distinguish a genuine performance change from ordinary variation. Specifically, we require at least 25 tests from at least 5 distinct client IPs to establish baseline performance measurements over the week preceding the tests we analyze. HERMES also caps the number of tests per IP to prevent a small number of frequent tests from dominating results and excludes measurements with inconsistent location metadata.
There is no universal threshold for “normal” latency or throughput: performance that is typical for one network and location may represent a serious degradation in another. The relevant question is therefore not whether a group is objectively fast or slow, but whether its users are performing substantially worse than usual. To account for this, HERMES compares current performance for the user group with the group’s recent baseline performance and identifies changes in performance relative to the baseline.
HERMES primarily looks for two signals:
- Increased latency: Data takes longer to make a round trip, causing interactive applications to feel delayed or unstable.
- Reduced throughput: Less data can be transferred over time, disrupting streaming, large downloads, and other high-capacity uses.
HERMES uses statistical tests to determine whether the distribution of measurements has changed and whether the degradation is sufficiently large and widespread to be of interest (see the paper for more details).
The Internet is a two-way trip
Once HERMES detects a performance degradation, it examines which network segments are associated with the affected connections and attempts to localize the source of the problem.
HERMES does this by combining performance measurements with traceroutes, which reveal the sequence of network hops along a path. Unlike most transportation networks, Internet paths are not negotiated end to end. Instead, each network independently chooses how to forward the traffic it carries. The networks carrying traffic from the server to the user may make a different sequence of routing decisions than those carrying traffic back to the server, which produces different paths. HERMES examines both the forward traceroute measured after each NDT test and, when available, a reverse traceroute from the user toward the server.
Our evaluation highlights the importance of taking a bidirectional view of network paths between the client and server. Half of the links implicated in performance events could be identified only by considering both directions. Among anomalous paths, the user-to-server route was geographically longer than the server-to-user route in 72% of cases and at least twice as long in 10% of cases.
HERMES uses two complementary forms of evidence to narrow down the source of the degradation. Specifically it asks:
What changed over time? HERMES compares paths observed during the degradation with those seen during normal periods. This can reveal a new detour, a disappearing link, or a shift to a different interconnection.
What distinguishes affected users? HERMES compares affected and unaffected connections to identify network segments that repeatedly appear on degraded paths. This can expose congestion or other problems even when the route itself has not changed.
HERMES considers both of these questions in parallel and combines the results.
Sometimes the set of available path measurements is not adequate to uniquely localize the source of a performance degradation. In these cases, HERMES can request a small number of targeted “forward” and reverse traceroutes, chosen to distinguish among the candidates. In our evaluation, these additional measurements reduced ambiguity by 47% on average and identified a single likely link in 31% of previously ambiguous cases.
HERMES does not claim to prove that a particular network caused a degradation. Instead, it reports the segments best supported by the available evidence and classifies each event as localized, ambiguous, or unresolved.
A slowdown in Chicago and a detour through Singapore
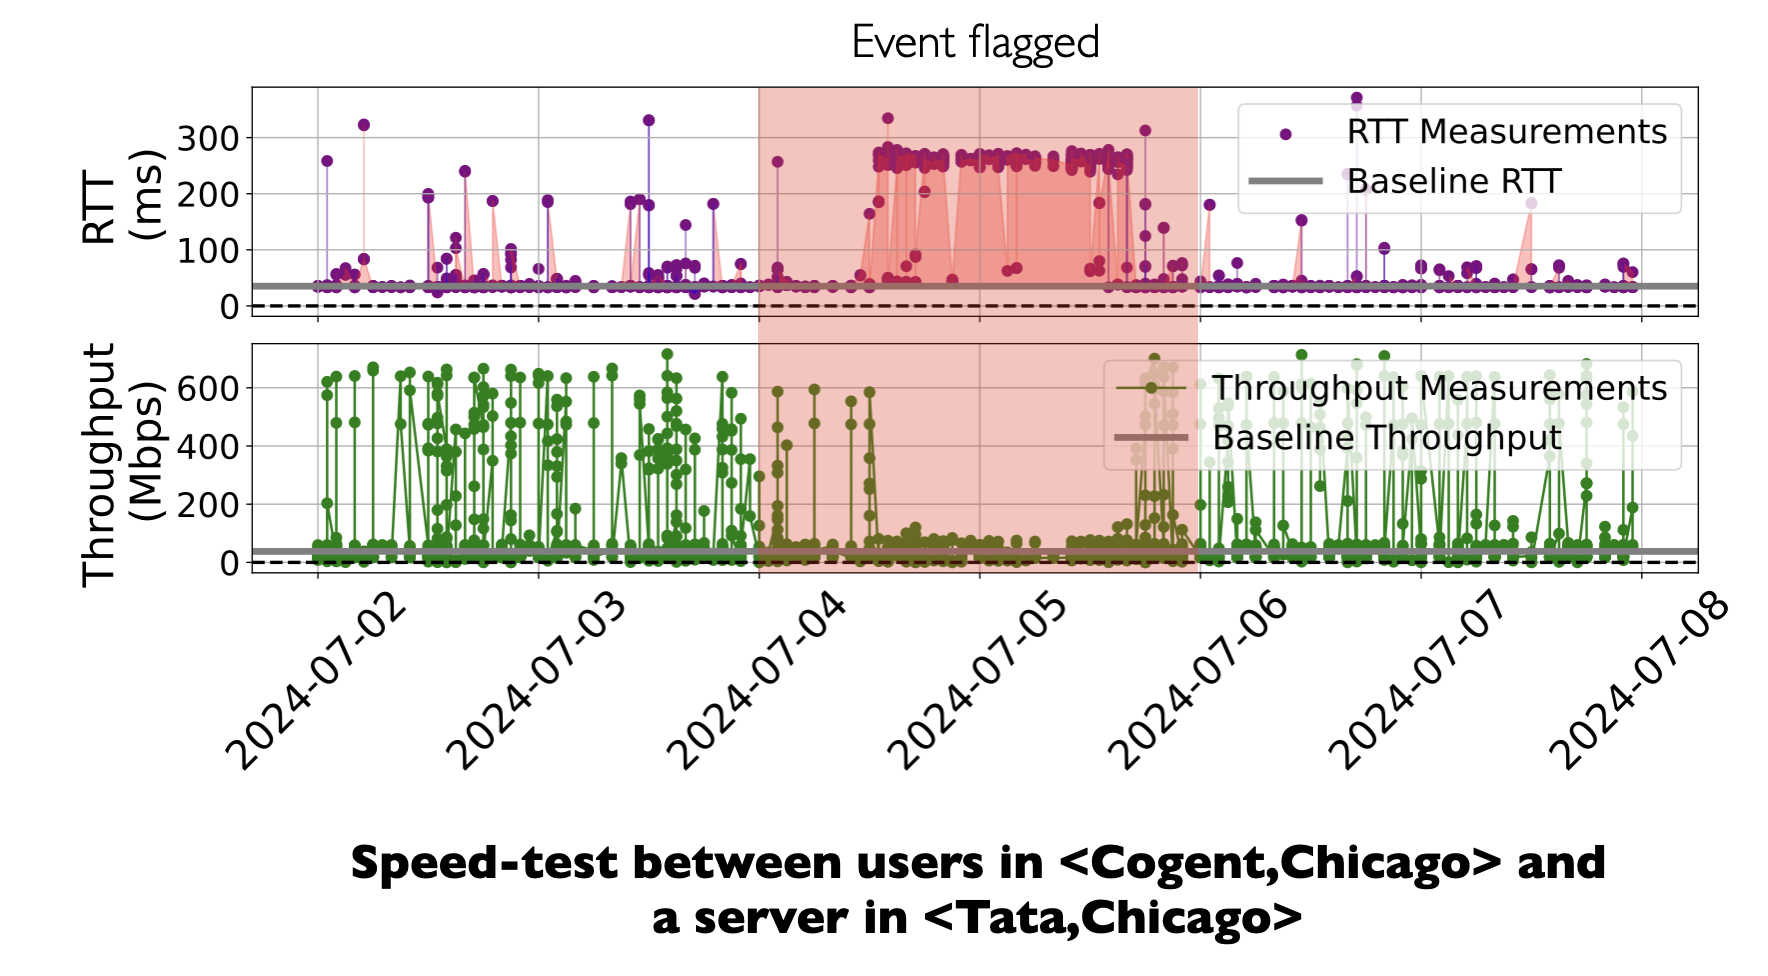
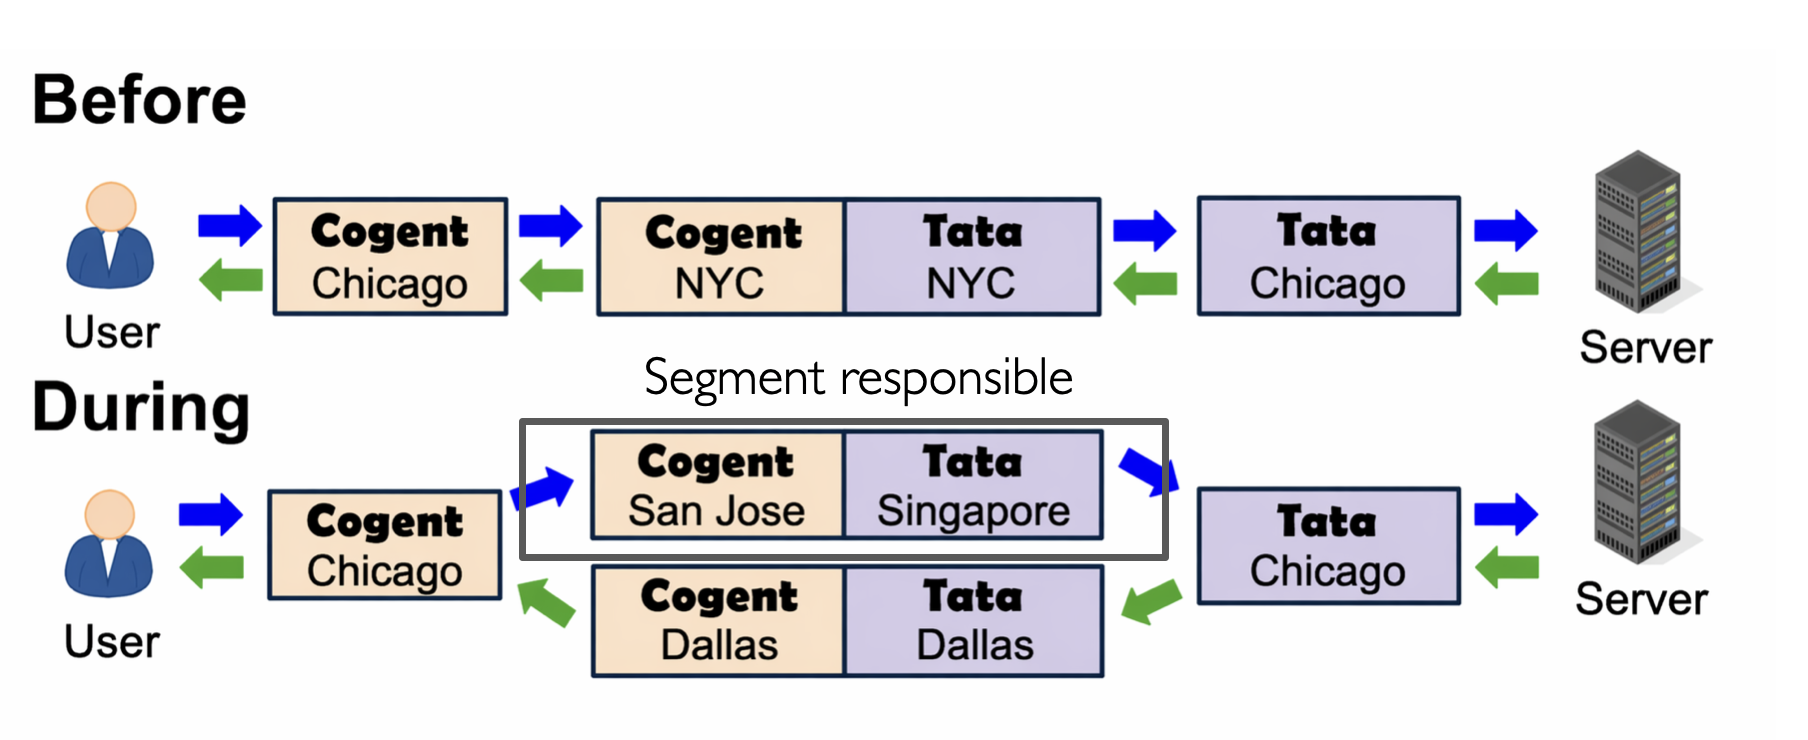
Figure 1. HERMES detects a sustained performance degradation (top) by comparing latency and throughput measurements against their recent baseline. It then localizes the degradation (bottom) by combining forward and reverse path measurements, identifying a routing change that diverted traffic through San Jose and Singapore instead of the usual Chicago–New York path.
On July 4 2024, HERMES found something unusual in Chicago. Cogent users were testing to a nearby M-Lab server hosted on Tata Communications’ network, yet their round-trip latency increased by more than 210 milliseconds and their throughput fell sharply. This was not an isolated slow test: the change appeared across the group relative to its recent performance.
The server-to-user paths provided only part of the explanation. Traffic was detouring through Texas, but that added only about 30 milliseconds. Reverse traceroutes revealed that most of the remaining delay originated from users’ traffic back to the server traveling through Singapore. Together, the two detours accounted for roughly 190 milliseconds of the increase.
The Chicago and New York interconnection points normally seen on these paths were absent that day. The evidence is consistent with traffic shifting to distant alternatives after the usual paths became unavailable, though it does not conclusively establish the cause.
Users noticed the degradation, prompting a Reddit discussion that generated more than 100 comments. The public outage observatories we checked did not. Connectivity had never disappeared, but HERMES could detect the shared performance change and use paths in both directions to investigate what had changed.
HERMES can also be used in the other direction: a user who notices poor performance can look up their network and location to see whether HERMES observes the same degradation, whether other nearby users are affected, and what network paths or components are associated with the change. In this way, HERMES can also be used as a tool for diagnosing an individual user’s performance problem in its broader context.
What we found at Internet scale
HERMES has been online since August 2024. In the paper, we evaluated HERMES using approximately 4 billion speed tests collected over five months. It identified about 65,000 performance events affecting user groups across 16,000 cities, 9,710 networks, and 166 countries.
We compared these results with several independent sources:
- Cloud-scale monitoring: A reimplementation of Blame-IT, a peer-reviewed monitoring system, using denser measurements from a large cloud provider, also detected 91.4% of HERMES events. Among events detected by both systems, the identified path segment agreed in 94.5% of cases.
- Provider reports: HERMES detected 25 of 27 documented incidents and identified a source consistent with the report in 23 cases.
- Operator and user reports: HERMES detected roughly ten times as many publicly discussed performance problems as the public observatories in our comparison.
No source provides complete ground truth because no comprehensive catalog of Internet performance incidents exists. Still, agreement across these independent sources suggests that sparse, public measurements can identify meaningful events without private operational data.
Seeing how disruptions affect usable connectivity
HERMES allows us to study how real-world disruptions affect performance even when connectivity does not disappear entirely.
During severe flooding in Andhra Pradesh, India, in September 2024, HERMES compared the share of monitored networks experiencing anomalies before and during the flooding. Metropolitan areas near the most heavily flooded region showed large increases in degraded performance, and the effects extended into some neighboring areas.
That wider footprint matters. Communications infrastructure is interdependent: damage or congestion at one location can reroute traffic onto shared fallback routes, affecting communities beyond the immediate disaster area.
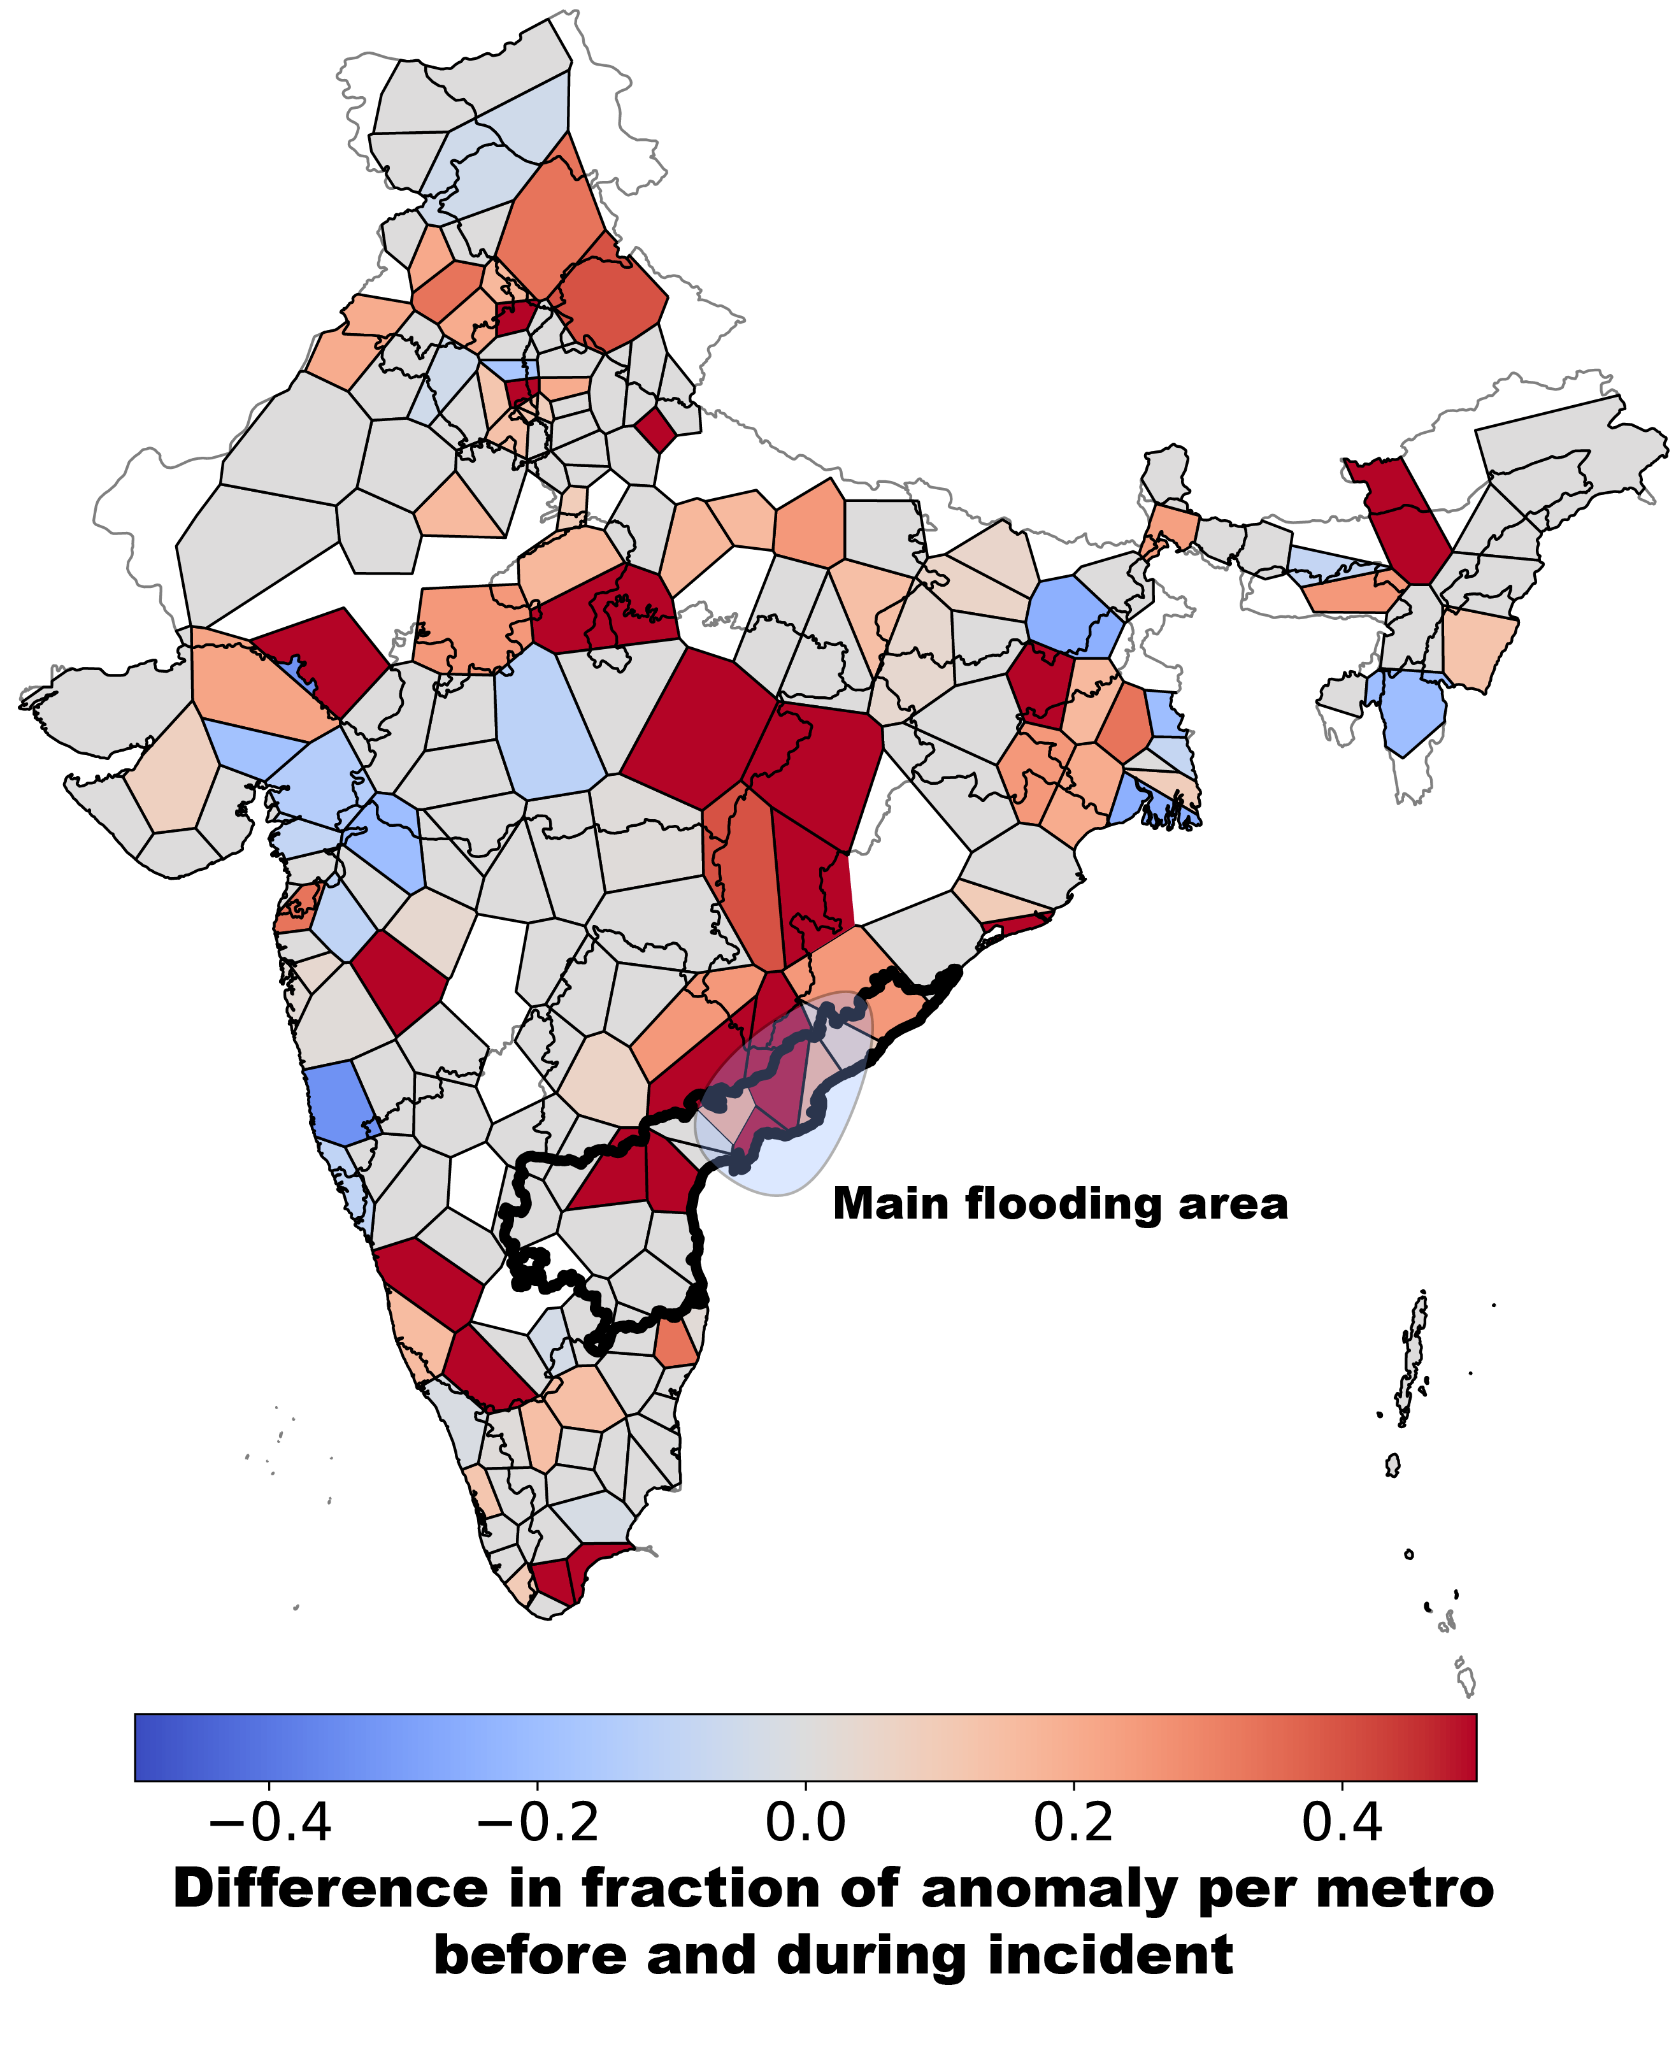
Figure 2. Change in the fraction of monitored networks experiencing a HERMES-detected performance anomaly during the September 2024 flooding in Andhra Pradesh, relative to the pre-flood period. Red areas indicate an increase in the fraction of monitored networks with a detected performance anomaly; blue areas indicate a decrease. The overlay marks the main flooded region. The map shows a temporal and geographic association, not proof that flooding caused every anomaly.
We observed similarly distinct patterns around flooding in Valencia, Typhoon Shanshan in Japan, a Baltic Sea cable cut, and major hurricanes. Some disruptions produced broad regional degradation; others remained sharply localized. That difference can help resilience planners understand whether redundancy and rerouting contained an incident or shifted its impact elsewhere.
How to use HERMES
HERMES provides public, end-to-end evidence about how Internet infrastructure performs during real-world disruptions. That evidence can be useful to several different groups.
Internet users and communities can determine whether a problem extends beyond their own connection. When a user experiences unusually slow Internet, it is often difficult to know whether the problem is local, specific to their provider, or part of a broader incident. HERMES can show whether similar degradations are affecting other users in the same region or network and whether the problem appears to involve shared infrastructure.
Network operators can use HERMES as an independent starting point for troubleshooting. Some incidents cross organizational boundaries, leaving no single provider with a complete view. In the Chicago incident, for example, the degradation was associated with a path crossing the Cogent–Tata handoff. HERMES provides shared end-to-end measurements and path evidence that can help identify the networks, locations, and interconnections most relevant to further investigation. It complements rather than replaces operators’ internal telemetry.
Researchers, policymakers, and public-interest organizations can study Internet resilience beyond outages. During the flooding in Andhra Pradesh, affected networks remained reachable even as HERMES detected widespread performance degradation. More broadly, HERMES can reveal recurring problems around particular metropolitan areas, interconnections, or transit segments; identify where additional measurement or infrastructure investment may be warranted.
In each case, HERMES exposes the measurements and localization evidence underlying an event. Users of the data can therefore inspect the evidence behind a conclusion rather than relying only on an aggregate score or provider assertion.
HERMES does not establish the root cause of an incident on its own, nor does it replace provider telemetry, field investigations or existing outage observatories. But it adds public end-to-end evidence that can reveal otherwise overlooked degradations, identify the networks and locations most relevant to an incident, and guide the additional investigation needed to establish its cause.
Important limits
HERMES provides public evidence about Internet performance, but that evidence must be interpreted within the limits of the underlying measurements. The most important caveats are:
The testing population is not representative of all Internet users. NDT tests are user initiated, and people may be more likely to run a test when they suspect a problem. This makes the data useful for surfacing potential incidents, but it means that speed tests (and HERMES by extension) should not be treated as a random survey of Internet performance.
Coverage varies across networks, locations, and time. HERMES reports on a user group only when enough measurements are available to support a comparison. The absence of a detected event may therefore mean either that performance remained stable or that there was insufficient evidence to evaluate it. It should not automatically be interpreted as proof that the network was healthy.
Daily analysis favors sustained degradations. By default, HERMES compares performance at daily resolution. This provides more robust evidence and reduces sensitivity to short-term noise, but it may miss incidents that last only a few minutes or hours.
Measurements to M-Lab do not represent every destination. Paths to M-Lab servers overlap with infrastructure used to reach many popular services, but routing is destination dependent. A degradation visible on an M-Lab path may not affect every application, while a problem on a path to another destination may not appear in HERMES.
Localization identifies association, not definitive responsibility. HERMES can identify network segments that are strongly associated with a degradation, but it cannot by itself establish the underlying cause or determine legal or operational responsibility. Provider telemetry, maintenance records, contractual relationships, and evidence of physical damage may still be needed to explain what happened and who was positioned to address it.
HERMES analyzes M-Lab’s public measurements in aggregate and does not attempt to identify individual test participants. Anyone working directly with NDT data should review M-Lab’s Privacy Policy and follow its guidance for responsible use.
These limitations are consistent with our broader guidance for policy and advocacy research: no single measurement source is appropriate for every question, coverage determines what can be observed, and changes in the testing population must be considered when interpreting results.
Conclusion: An open observatory built on open measurements
M-Lab’s mission is to measure the Internet, save the data, and make it universally accessible and useful. HERMES demonstrates what becomes possible when that long-running public record is combined with careful statistical analysis and bidirectional path measurements. The result is an observatory for the failures between “online” and “offline”: the slowdowns, detours, and congested interconnections that impact whether people can actually use the Internet.
You can:
- explore detected events and their supporting evidence on the HERMES public dashboard;
- inspect the methodology and open-source pipeline in the HERMES GitHub repository; and
- read the peer-reviewed paper, “HERMES: Repurposing User-Driven Speed Tests to Monitor the Internet”.
Network operators can also help expand what HERMES can observe. HERMES’s visibility ultimately depends on where M-Lab measurements are available. Deploying an M-Lab server can increase measurement coverage in a region and expose Internet paths and interconnections that might otherwise be sparsely observed. ISPs, network operators, universities, and other eligible organizations can contribute infrastructure through M-Lab’s host-managed server program.
Open measurement cannot eliminate Internet failures, but it can make them harder to overlook and easier for operators, researchers, civil society, and policymakers to investigate from the same set of facts.