M-Lab to the Cloud: Virtual sites in all Google Cloud regions
As of April 2023, we are excited to announce that M-Lab has a virtual site running ndt-server in all 35 GCP regions.
In July 2022 M-Lab announced our initiative “M-Lab to the Cloud”. The pilot deployment directed a small percentage (less than 10%) of NDT clients in a few select regions to cloud nodes (servers) running on Google Cloud virtual machines. Today we are excited to share that we have a fully virtual site running in all 35 Google Cloud regions. In this blog post we will revisit our motivations for “M-Lab to the Cloud”, describe our quality assurance analysis, and share our plans for future work including the support needed to make it happen. We emphasize that this is a first step towards running M-Lab servers on public clouds more broadly. We are actively working to expand to more clouds/CDNs and looking for partners to make this happen!
Background & Motivations
Since our launch in 2009, M-Lab’s server-side software has been deployed on physical, bare metal machines. At the time, cloud storage and computing were only beginning to develop, but over the past decade the relevance of cloud technologies to content delivery on the Internet has only increased. When we launched our pilot deployment in July 2022, we shared our motivations for expanding to cloud environments which included measurement of more Internet paths, more flexible deployments and alternate deployment models for measurement services. Our pilot has increased our options for server deployment and the diversity of paths that we measure. Additionally, the milestone we are announcing today will enable us to explore in more detail what new measurement techniques are made possible by cloud infrastructure.
Bare-Metal Servers vs. Cloud VMs - Performance Comparisons
For the past six months we monitored the resulting data for quality assurance. In particular, we performed an experiment where we shifted load for physical sites in a metro (Mumbai (BOM)) to a cloud VM located in the same metro. Here, we present the results of this test.
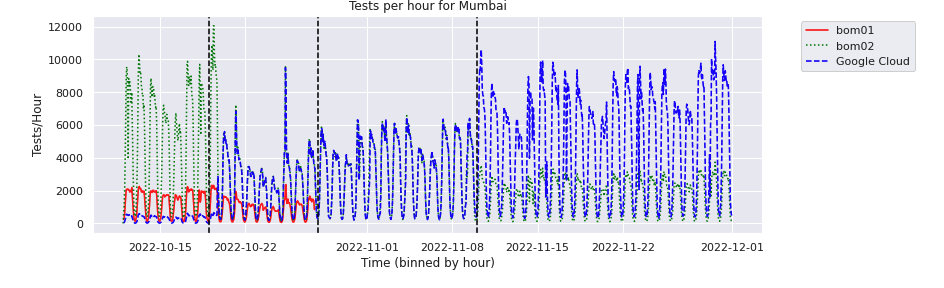
In the BOM metro, we have 2 physical sites which we refer to as ‘bom01’ and ‘bom02’. BOM is the 3rd busiest metro in our platform serving an average of 273K tests per day in September 2022. Our test began on October 19, 2022 when we set the probability of selecting a server in bom02 and the cloud node to be equal. After running in this configuration for ~10 days, we turned down the physical site in bom01, leaving the physical site in bom02 and the cloud node to handle the load on October 28, 2022. We again let this configuration run for some time and on November 10, 2022 we set the bom02 physical site to receive one third of tests, with the cloud server serving the other two thirds. The figure below shows the hourly test volume during our tests. We include a period of 7 days prior to October 19, 2023 to show the baseline test volume per site before our experiment began.
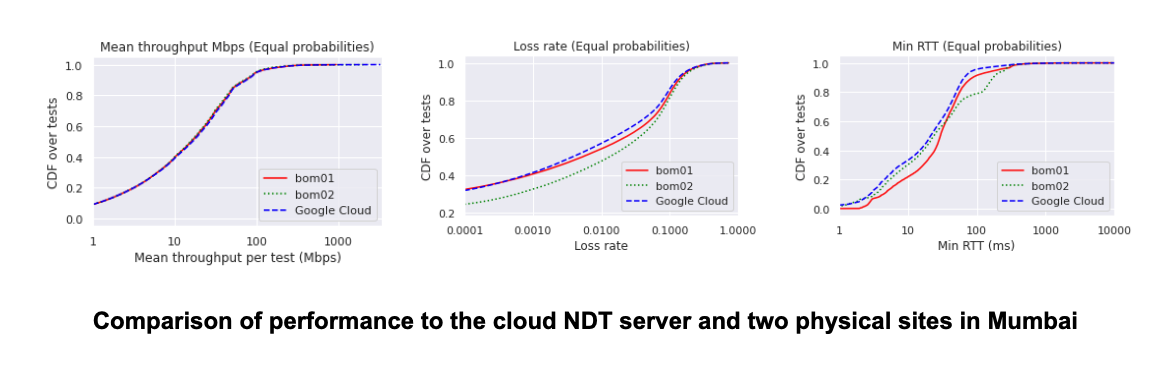
We first check that the cloud NDT server performs similarly to our existing physical servers. The plots below show the cumulative density function (CDF) of throughput, loss rate, and round-trip time (RTT) for servers in bom01 and bom02 and the server in Google Cloud. These plots are from the period after October 19, 2022 when we increased the load on the cloud server to be equal to the load on the bom02 physical site. The distribution of throughput measured by the two physical sites and the cloud server is quite similar. However, we do observe some differences in terms of loss and latency. The cloud server has the lowest loss rate, followed by bom01 and then bom02 with the highest loss rate of the three sites. In terms of round trip time, the cloud server has lower latency than the two physical sites which show higher latency and in the case of bom02 more variable latency. Overall, these results support our conclusion that the cloud VM is able to produce measurements consistent with the physical sites.
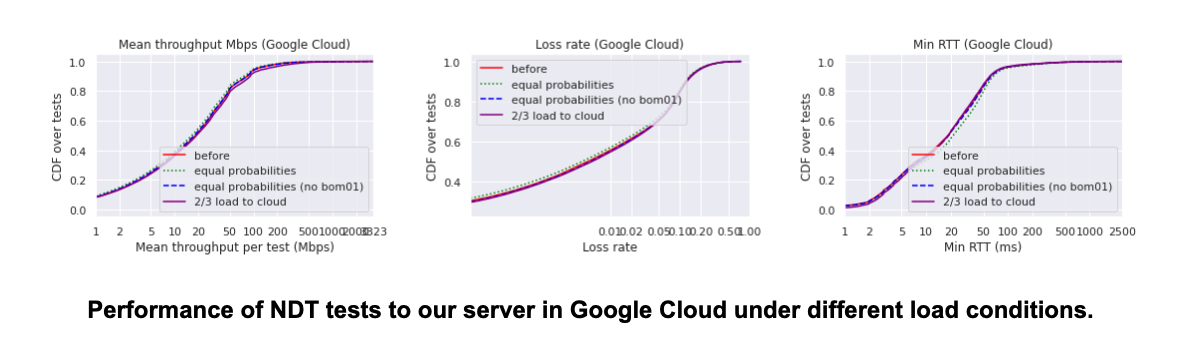
We next check that the cloud node is able to keep up with the increased load during our experiments. The plot below shows the CDF of throughput, loss rate, and RTT for the NDT server on Google Cloud. Each plot shows the distribution before our experiments as well as during the three experimental conditions. We do not see a significant difference in performance for any of the metrics among the different experimental conditions. This confirms that the cloud NDT server is able to keep up as we increase the load on the server.
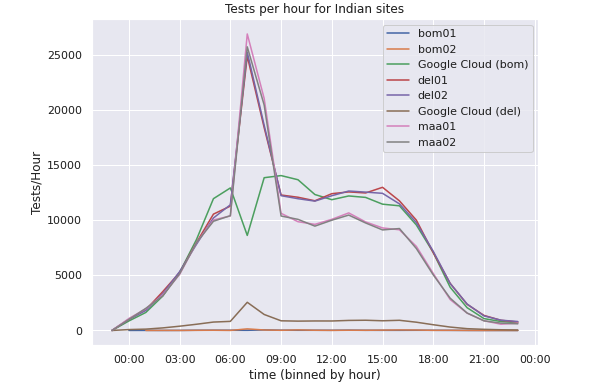
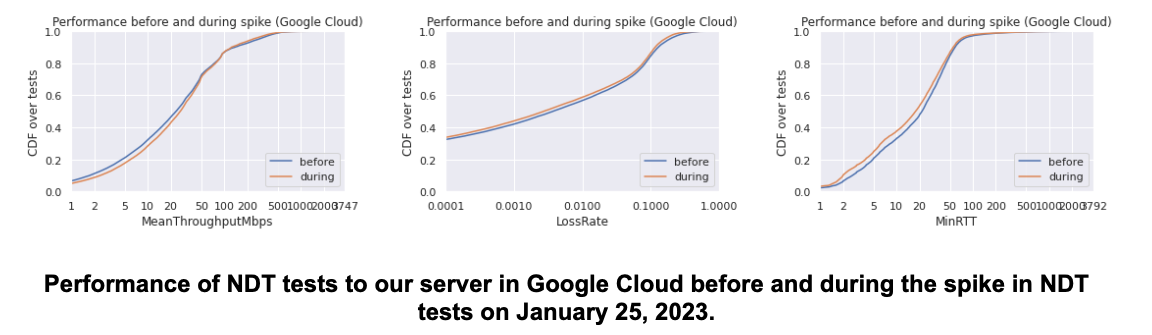
On January 25, 2023 we had an opportunity to test the cloud server under extreme load as there was a spike in NDT tests from India. The plot below shows the hourly test volume to all of our physical sites in India as well as our two cloud servers. The cloud server in Mumbai receives nearly all of the tests for the metro whereas the cloud server in Delhi (del) only receives a small fraction of traffic as we test the virtual NDT servers. All sites show a sharp spike in tests per hour between 6 am and 9 am. However, we notice that the cloud NDT server in Mumbai actually experiences a drop in tests at this time. Upon closer inspection, we found that the cloud server in Mumbai was under high load with high memory and disk utilization which led to this server receiving fewer tests during the spike in NDT tests.
We compared the performance of NDT tests to our cloud server in Mumbai before and during the spike in testing on January 25, 2023 and found that performance is actually slightly better for tests that use the cloud node (slightly lower loss and latency and slightly higher throughput). This is due to our locate service directing traffic to other servers when the cloud server experienced resource limitations during the spike. In this case, the platform behaved as expected, directing clients to servers that could handle their load and not impacting the results of NDT testing. It is worth noting that the cloud server had considerably less resources than the other sites with the cloud server having 4GB of RAM relative to 16GB in our physical servers. We are currently investigating higher-resourced-VMs as well as Google Cloud’s auto-scaling functionality to increase the capacity of the cloud server.
Current M-Lab deployment in Google Cloud
As of today, M-Lab provides at least one ndt-server VM in every Google Cloud region (currently 35 in total, subject to increase). Three of these regions have 3 VMs (hnd, gru, bom), while the rest have one, which makes for a total of 41 virtual servers. Apart from hnd, gru, and bom, the probability that our server selection tool, Locate, will select a virtual site is 20%, meaning that it will send 30% of tests in that metro to the cloud server. As a result, cloud traffic accounts for 13% of our traffic volume.
Before increasing the amount of traffic that is sent to cloud sites, we are soliciting partnerships with more cloud providers to provide a more balanced view of the cloud ecosystem. If you have an interest in sponsoring our expansion to the cloud, via either direct donation of cloud resources or indirect sponsorship, please consider supporting our work.
Future Work and Support
This milestone is just the beginning of our expansion of M-Lab infrastructure into modern cloud computing environments. To fully realize the vision for “M-Lab to the Cloud” we need to make progress towards the following:
- Expansion to additional cloud environments beyond Google Cloud
- Transitioning existing measurement services to be deployable on cloud nodes
- Soliciting measurement services from the Internet measurement community that utilize or benefit from hosting in a cloud environment
We need your support to make these happen. We are actively seeking partners to support this important work that will benefit all users of M-Lab’s open data and tools. Here’s how you can help:
- Donate resources or host an M-Lab server in your network. We are specifically interested in more deployment in cloud and content delivery networks (CDNs).
- Propose ideas or prototypes for cloud-specific measurement services
- Make a recurring donation to support either of the above
- Join our community of contributors
- See all the ways to get involved in Measurement Lab