These example visualizations illustrate how others have explored the state of networks using M-Lab data.
Network State
These visualizations illuminate the state of networks using M-Lab measurements.
RIPEstat Widgets Explore Network Activity
RIPEstat is a web-based interface developed by the RIPE NCC featuring visualization widgets and data APIs dedicated to making sense of Internet data. RIPEstat now includes:
The Observed Network Activity widget, which shows the distribution of actively used IP addresses within a specific country or network during a user-defined time period. An IP address is considered “active” if it originated an NDT test.
The [Observed Bandwidth Capacity widget](https://stat.ripe.net/widget/bandwidth, which shows the bandwidth distribution within a specific country or network during a user-defined time period, as measured by NDT.
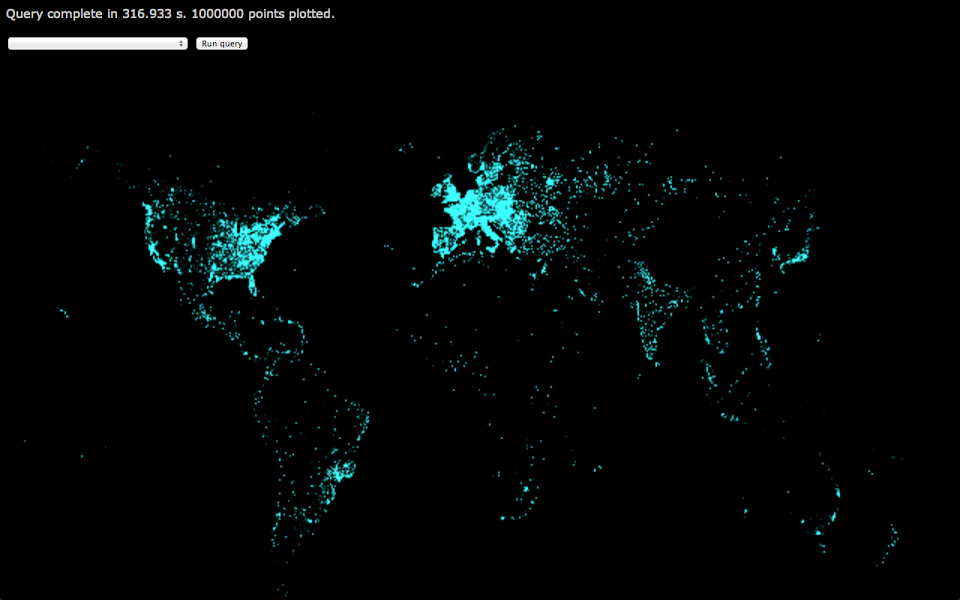
Distribution of NDT tests
The image below is taken from an animation that shows each NDT test run between February 2009 and November 2012 as a small dot. For more information about how the chart was created, see http://dominichamon.com/blog/2012/12/visualizing-m-lab-data-with-bigquery-part-two/.