Measurement Lab Launches New Global Data Visualization Tools
The Measurement Lab (M-Lab) global measurement platform contains the largest collection of open Internet performance data on the planet. Hundreds of thousands of people (and rising everyday!) test their Internet connections on M-Lab and provide that data to the public domain for research, analysis and advocacy. As a consortium of research, industry, and public-interest partners, M-Lab is dedicated to providing an ecosystem for the open, verifiable measurement of global network performance. With an extensive library of data dating back to 2009, M-Lab has over 5 petabytes of information about quality of experience on the Internet contributed by people like you.
With so much data available, analyzing trends from the data can be a daunting task. That’s why, over the last year, we’ve been working to improve access to our data through visualizations and applications. At the end of 2015, we launched the Observatory to support the M-Lab study ISP Interconnection and its Impact on Consumer Internet Performance, which made it possible for policy makers, researchers, journalists and others to monitor and analyze data about how interconnection points between Internet service providers (ISPs) in the United States impact quality of experience. 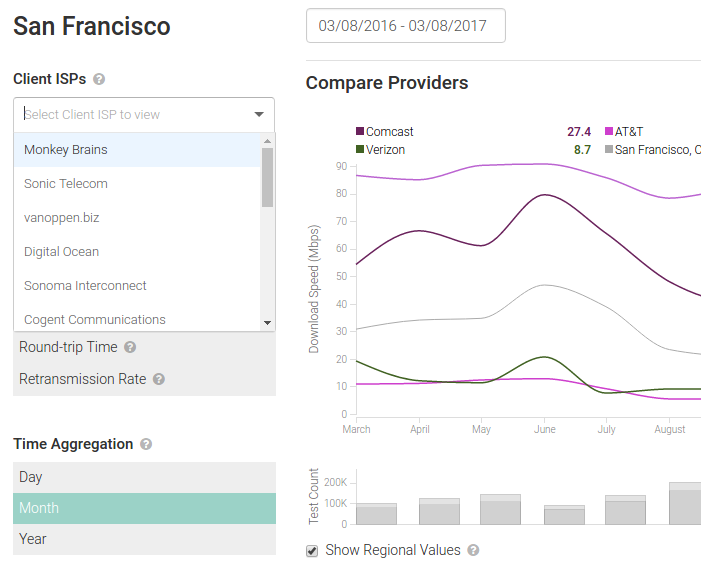 But M-Lab has much more data than just from the United States: it also has data from around the world and on many more ISPs, so we wanted to provide a tool that allowed anyone in the world to dig into our Internet performance measurement test (NDT) data for their location. In 2016, we launched an initiative to revamp our visualizations and move to using open source technology to make them more flexible and auditable by the community. We worked with Bocoup, an open source technology and design consulting firm, to develop a data processing pipeline, API and visualizations all of which contribute to making the data more explorable.
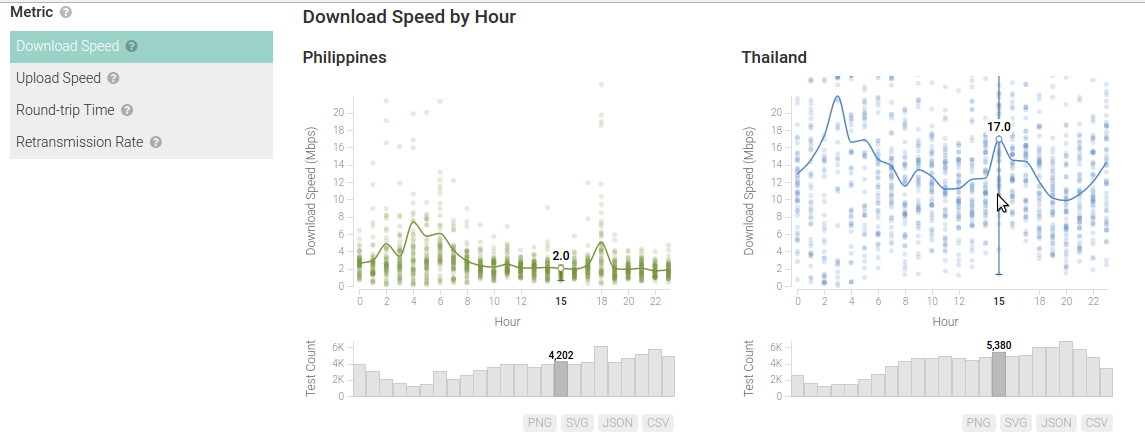
At M-Lab, we believe that an open Internet is the foundation of access and innovation, where users can go where they want, when they want without discrimination, but how do we know if the Internet is truly open? By designing these new visualizations, now anyone, regardless of their technical expertise, can explore how their Internet experience is mediated by the various actors that make the Internet function.
If you are into open source visualization, read more about the project over on Bocoup’s blog as well.