New Opportunities for Test Deployment and Continued Analysis of Interconnection Performance
In late April, Internet2, with contributions from M-Lab developers, released an updated version of the Network Diagnostic Tool (NDT), M-Lab’s most widely deployed performance measurement test. In addition to improved stability, the updated version of NDT makes it possible to measure network performance from a web browser without the need for browser plugins. This change removes a layer of complexity and hassle for developers and users. Anyone interested in Internet measurement can now create their own NDT client targeted for specific user populations, regions, and research objectives, using only HTML and Javascript.
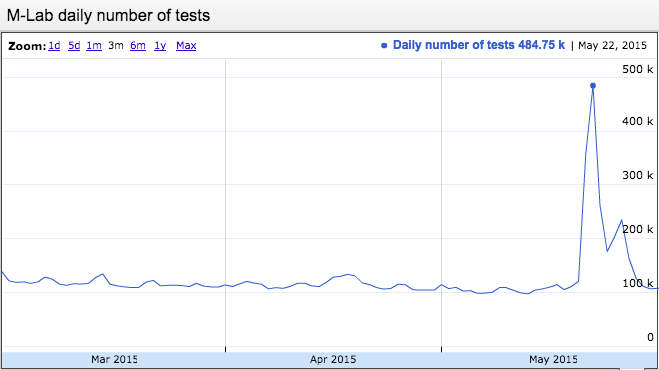
A number of third parties have already begun this process, from regulators to service providers. Each is building and using their own measurement clients for their own purposes, all while contributing standardized data to M-Lab. More data makes possible more concrete and fine-grained analysis, and a more comprehensive view of international Internet performance patterns. Among those who have taken advantage of this change in NDT is Battle for the Net, a coalition of public interest advocacy organizations. The coalition released and distributed the Internet Health Test, which resulted in a large spike in tests and a concomitant increase in the amount of data M-Lab collected – on the order of 2.5 million data points from 300,000 Internet users, mostly located in the United States.
With the increased quantity of data resulting from the expanded deployment of NDT clients, M-Lab has been able to look more deeply into how ISP interconnection impacts consumer Internet performance over time and across different networks. This expanded analysis includes new ISP pairs within the United States that had not previously been studied.
In our analysis of this newly-expanded dataset, we used the same approaches used in our October 2014 technical report, ISP Interconnection and its Impact on Consumer Internet Performance, to analyze performance across ISP pairs during the first half of 2015.
Our initial findings show persistent performance degradation experienced by customers of a number of major access ISPs across the United States during the first half of 2015. While the ISPs involved differ, the symptoms and patterns of degradation are similar to those detailed in last year’s Interconnections study: decreased download throughput, increased latency and increased packet loss compared to the performance through different access ISPs in the same region. In nearly all cases degradation was worse during peak use hours. In last year’s technical report, we found that peak-hour degradation was an indicator of under-provisioned interconnection capacity whose shortcomings are only felt when traffic grows beyond a certain threshold.
Patterns of degraded performance occurred across the United States, impacting customers of various access ISPs when connecting to measurement points hosted within a number of transit ISPs in Atlanta, Chicago, Los Angeles, New York, Seattle, and Washington, D.C. Many of these access-transit ISP pairs have not previously been available for study using M-Lab data. In September, 2014, several measurement points were added in transit networks across the United States, making it possible to measure more access-transit ISP interconnection points. It is important to note that while we are able to observe and record these episodes of performance degradation, nothing in the data allows us to draw conclusions about who is responsible for the performance degradation. We leave determining the underlying cause of the degradation to others, and focus solely on the data, which tells us about consumer conditions irrespective of cause.
Notable instances of performance degradation include, but are not limited to:
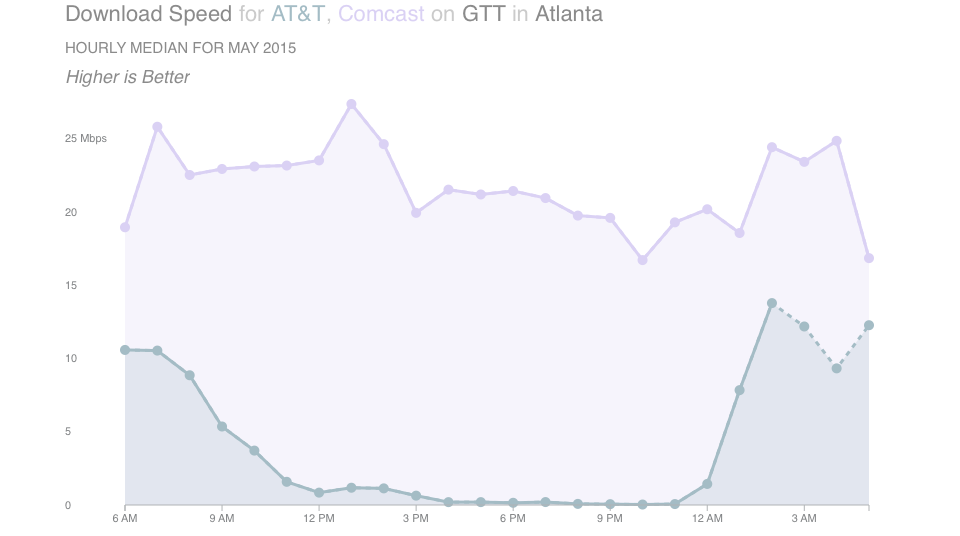 AT&T over GTT in Atlanta, Chicago, and Los Angeles AT&T users experienced the most consistent patterns of congestion-related degradation across measurement points on a diversity of transit ISPs, most notably on GTT for Atlanta, Chicago and Los Angeles. In Chicago and Atlanta, this degradation was its most extreme with peak hour performance frequently less than 0.1 Mbps. Other access ISPs such as Comcast did not display as substantial of degradation to those same sites during the same period.
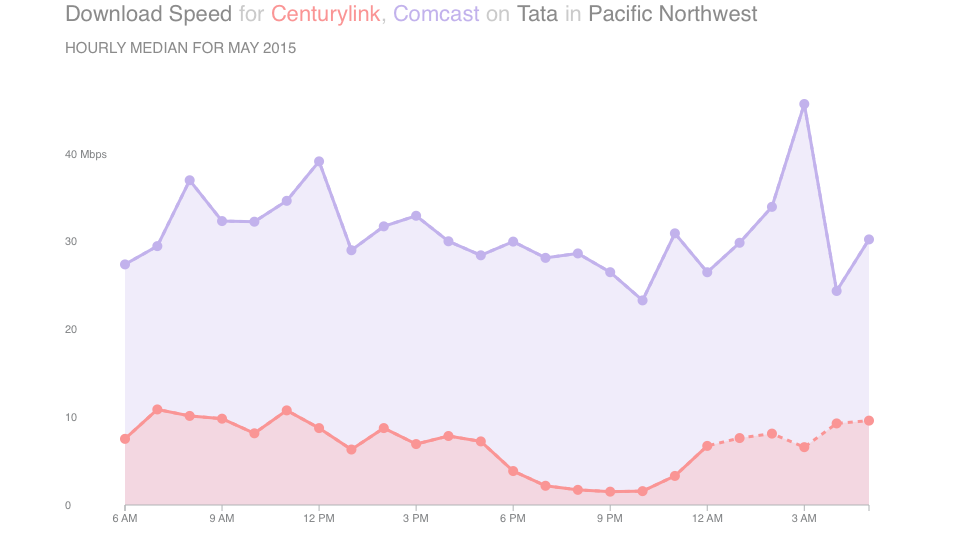 Centurylink over Tata in Seattle In Seattle, Centurylink clients received consistent speeds across the day to Cogent-hosted measurement endpoints, while the peak hour performance to Tata was less than 1 Mbps. While the Tata measurement point is new, this congestion appeared at the start of collection of data, indicating that it pre-dates September 2014. As a point of comparison, Comcast did not experience similar degradation in Seattle for Tata.
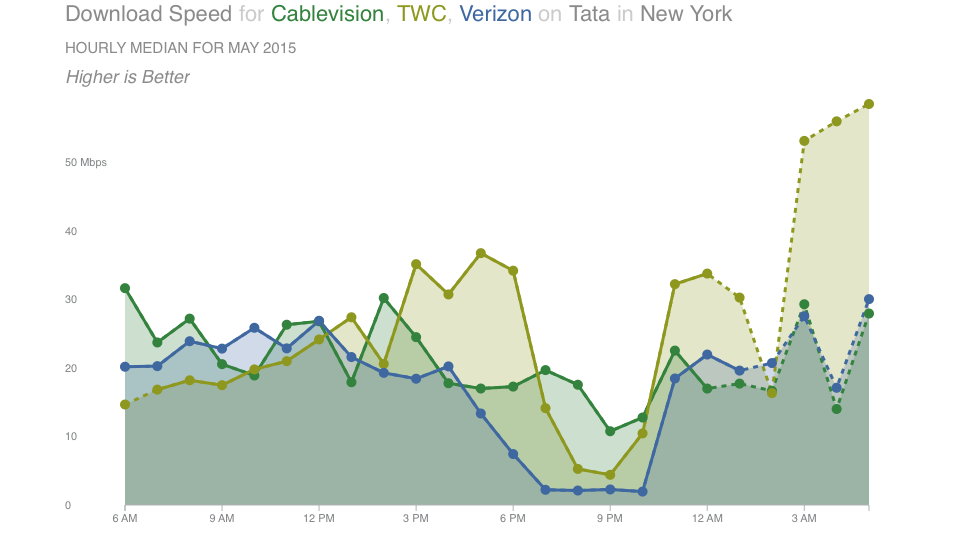 Comcast, Time Warner Cable, and Verizon over GTT and Tata in New York City M-Lab’s New York sites received the highest number of tests and experienced more congestion incidents than other locations, both likely a product of the population density of the region and the city’s importance for global connectivity. Customers of Comcast, Time Warner Cable, and Verizon all saw degraded performance during peak use hours when connecting across transit ISPs GTT and Tata. These patterns were most dramatic for customers of Comcast and Verizon when connecting to GTT, with a low speed of near 1 Mbps during peak hours in May. None of the three experienced similar problems when connecting with other transit providers, such as Internap and Zayo, and Cablevision did not experience the same extent of problems.
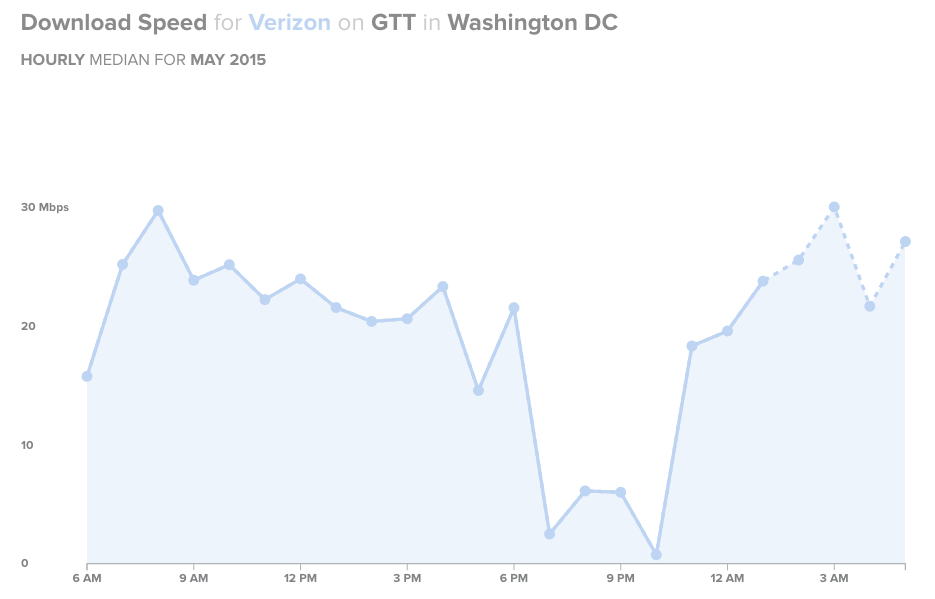 Verizon over GTT in Washington D.C. In Washington D.C., customers of Verizon experienced severely degraded performance when connecting across GTT. Comcast and Time Warner Cable customers also experienced degradation across GTT, but to a lesser extent.
These episodes and much more data are visualized and publicly available in the Internet Observatory, a dynamic data-visualization tool that allows consumers, policymakers, and researchers to better understand the impact of ISP relationships on their own Internet access and performance. As with all of our research, we invite anyone interested to access the original data and draw their own conclusions. It’s all published in its complete and raw form, in the public domain.
Collin Anderson, on behalf of M-Lab researchers
About Measurement Lab (M-Lab)
M-Lab is a consortium of research, industry, and public interest partners dedicated to providing an ecosystem for the open, verifiable measurement of global network performance. As a collaborative effort, M-Lab depends on the support and involvement of a broad network people and organizations across disciplines and expertise. If you’d like to be a part of the largest open measurement effort on the planet, don’t hesitate to get involved.