Data Duplication Bug in M-Lab BigQuery Data
The team working on archiving M-Lab data recently discovered that the M-Lab data hosted in BigQuery was affected by a bug that caused duplicates to appear in our dataset. Queries against M-Lab’s BigQuery dataset performed between May 2014 and April 2015 were impacted. The raw files in our Google Cloud Storage bucket were not.
M-Lab is committed to open data. The team that manages hosting and archiving M-Lab data in BigQuery and Google Cloud Storage ahdere to these principles, and this includes transparently disclosing issues we discover with these archives. We have written this post with the goal of helping users of BigQuery’s M-Lab data archive to understand the impact of this bug on any data they may have collected during the affected period.
Duplication Details
Fortunately, the duplication was fairly uniform and regular. In the BigQuery tables affected by this issue, all M-Lab tests for a given day at a given site appeared twice instead of once. In other words, if a user were to create a query to find the number of NDT tests performed on June 1, 2013 at lax01 (one of M-Lab’s Los Angeles US sites), they would get a result with ~11,000 rows when only ~5,500 tests were actually performed. When duplication occurred, it was usually for all sites that day, but there were some days on which certain sites were affected while others were not. Note that the per-day granularity of this bug means that within a given month, some days contained duplicates while others did not.
There were a limited number of cases where the duplication did not fit into this regular pattern, but this only appeared in four months (May 2013, Nov. 2013, Feb. 2014, and Apr. 2014). The issue affected fewer than 20 tests in any given month (out of the roughly 3 million monthly tests we archive).
This issue was introduced into the dataset sometime in May 2014. We fixed the root cause of this issue and reprocessed the dataset to remove all duplicates. As of April 15, 2015, all duplicates have been removed from the M-Lab BigQuery dataset.
The table below details the effect of the duplication bug on each of the BigQuery tables. Note that the table is organized not by time of query, but according to the time the M-Lab test occurred, as that is how M-Lab data is partitioned into tables in BigQuery.
| Month / BigQuery Table | Impact |
|---|---|
| Feb. 2009 - Dec. 2011 | Unaffected |
| Jan. 2012 | Affected, but only during a brief window. Only queries performed between Jan. 12, 2015 to Jan. 30, 2015 for data in Jan. 2012 would have returned duplicate results. |
| Feb. 2012 - Apr. 2013 | Unaffected |
| May 2013 - Feb. 2014 | Affected |
| Mar. 2014 | Unaffected |
| Apr. 2014 - May 2014 | Affected |
| Jun. 2014 - Jul. 2014 | Affected, but only for data collected from sites lba01 (Leeds, UK) and tun01 (Tunis, Tunisia). |
| Aug. 2014 - Present | Unaffected |
Impact on M-Lab 2014 Interconnection Study
This bug affected the data that researchers used in last year’s M-Lab Interconnection Study. However, the effect on the published findings in the study was negligible, save for adjusting down reported sample sizes.
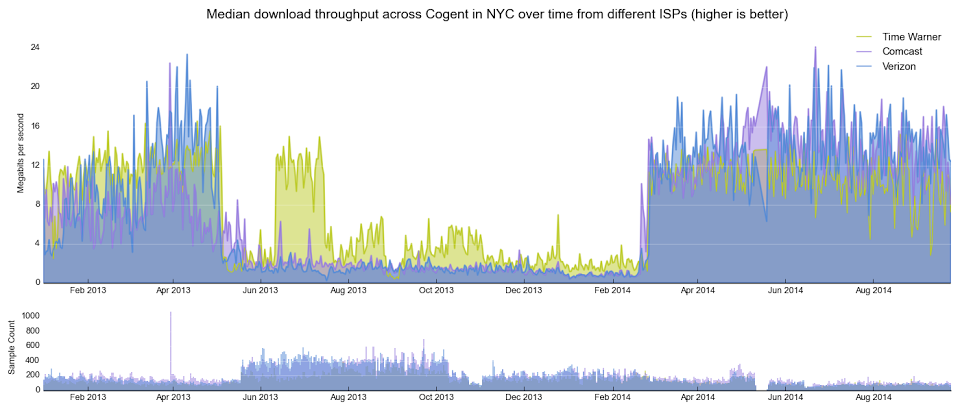
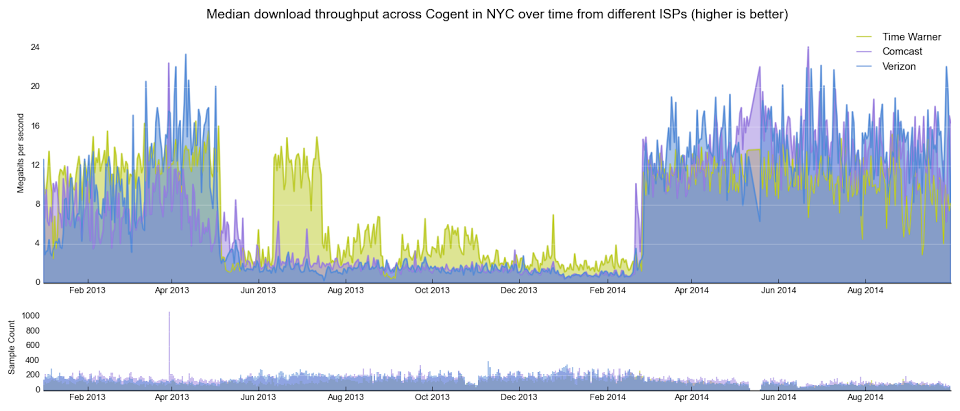
Why did this bug not impact the study finding? Most of the researchers’ analysis was based on median values of different performance metrics. Given that duplicating every element of a set does not change its median, the values we calculated for per-day medians remained the same. The images below show one of the graphs from the original report and below it the amended version of that graph after removing duplicates. The sample size changes, but the throughput values are identical. (Thank you to Collin Anderson and others for helping perform and verify this analysis.)
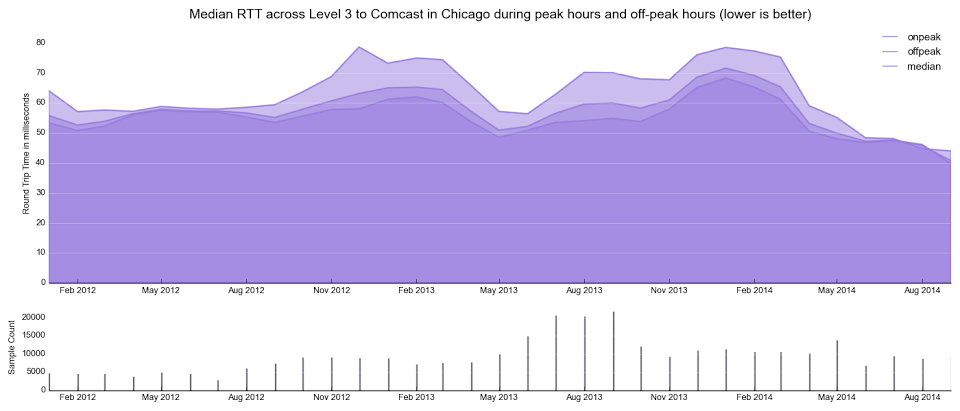
While not significant, instances where researchers calculated the monthly median of different metrics were not as straightforward as daily medians. In instances where only certain days of the month contained duplicates, calculated medians were skewed toward the duplicated days. After correcting for the duplicate values and working with M-Lab researchers to re-run the analysis, we confirmed that the effect on calculated values was not significant. At its most pronounced, we see a change in values of no more than 10%, generally much lower. The graph below provides an example of slight changes to the round-trip times after correcting for duplicate data. Here and in all cases, after correction the trends reflected in the graphs remain exactly the same.

Actions Taken
We take problems in data archives very seriously, and we have taken the following actions to address this issue:
-
Fixed the underlying bug that was causing duplicate tests to appear in BigQuery.
-
Reprocessed the affected tables in our BigQuery dataset to cleanse the dataset of duplicates.
-
Notified M-Lab researchers and consumers of our data via the discuss@measurementlab.net mailing list.
-
Worked with researchers to update the M-Lab Observatory with the corrected data.
Worked with researchers to publish amended graphs and raw data from the M-Lab 2014 Interconnection Study on Google Cloud Storage.